Government Health Insurance
Question Language
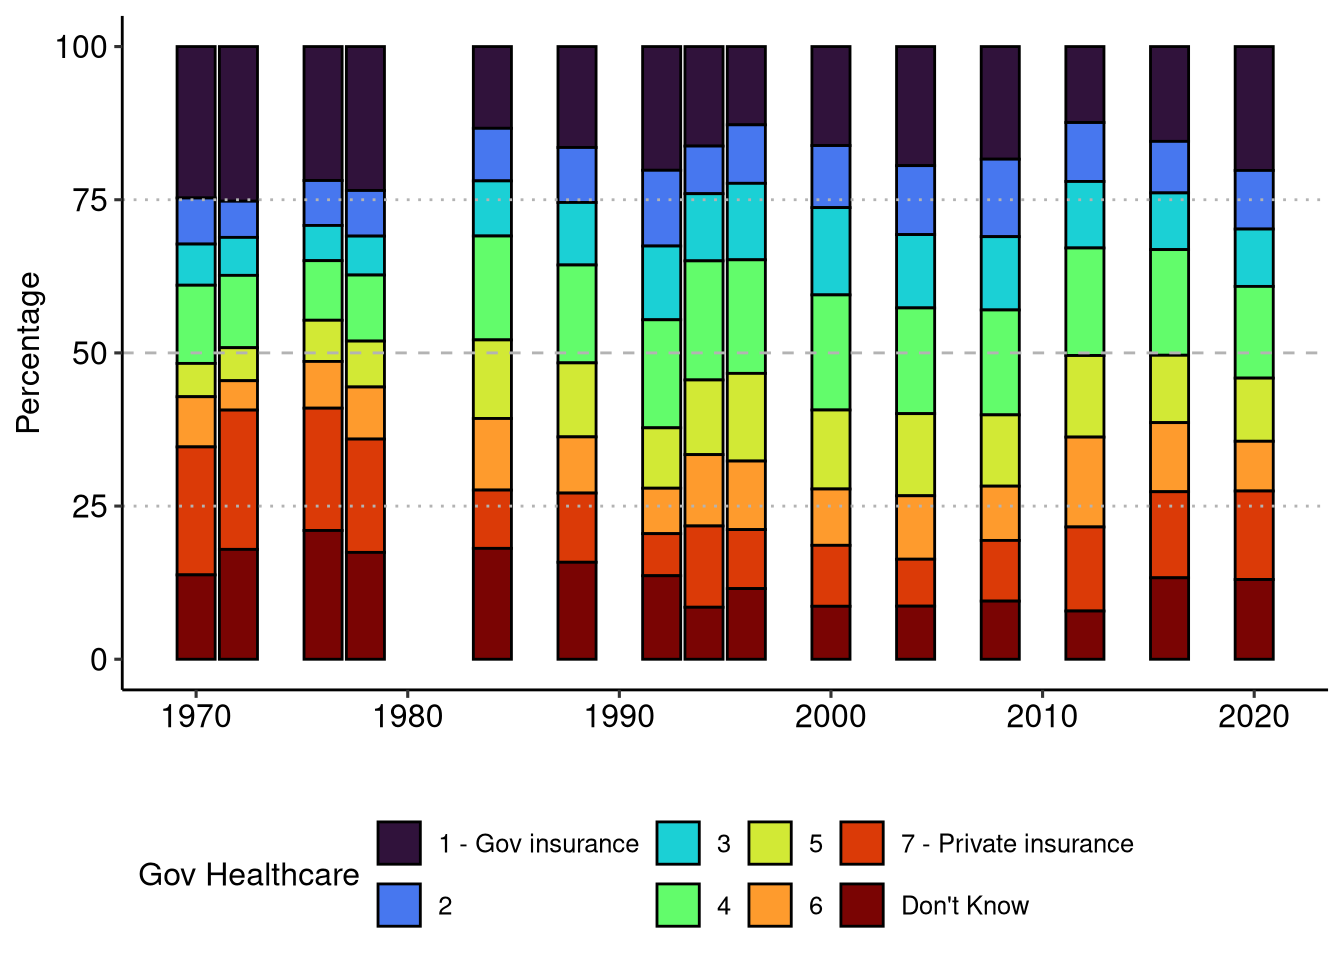
There is much concern about the rapid rise in medical and hospital costs. Some (1988,1994-LATER: people) feel there should be a government insurance plan which would cover all medical and hospital expenses (1984 AND LATER: for everyone). (1996,2004: Suppose these people are at one end of a scale, at point 1). Others feel that (1988,1994-1996: all) medical expenses should be paid by individuals, and through private insurance (1984 AND LATER: plans) like Blue Cross (1984-1994: or [1996:some] other company paid plans). (1996,2004: Suppose these people are at the other end, at point 7. And of course, some people have opinions somewhere in between at points 2,3,4,5 or 6.) Where would you place yourself on this scale, or haven’t you thought much about this? (7-POINT SCALE SHOWN TO R)
- Government insurance plan
- Private insurance plan
- DK; haven’t thought much about it
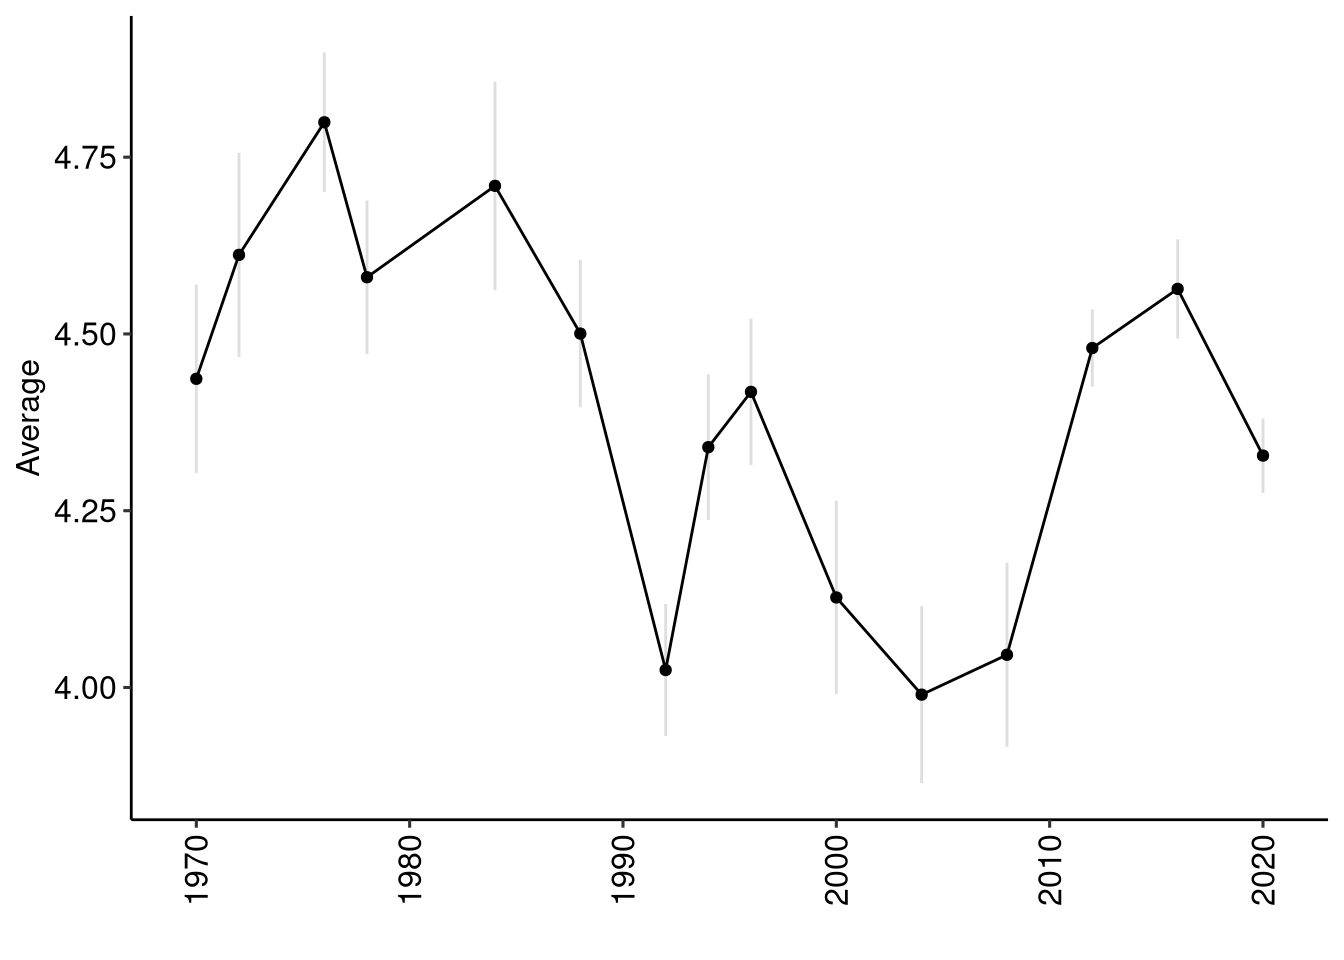
All
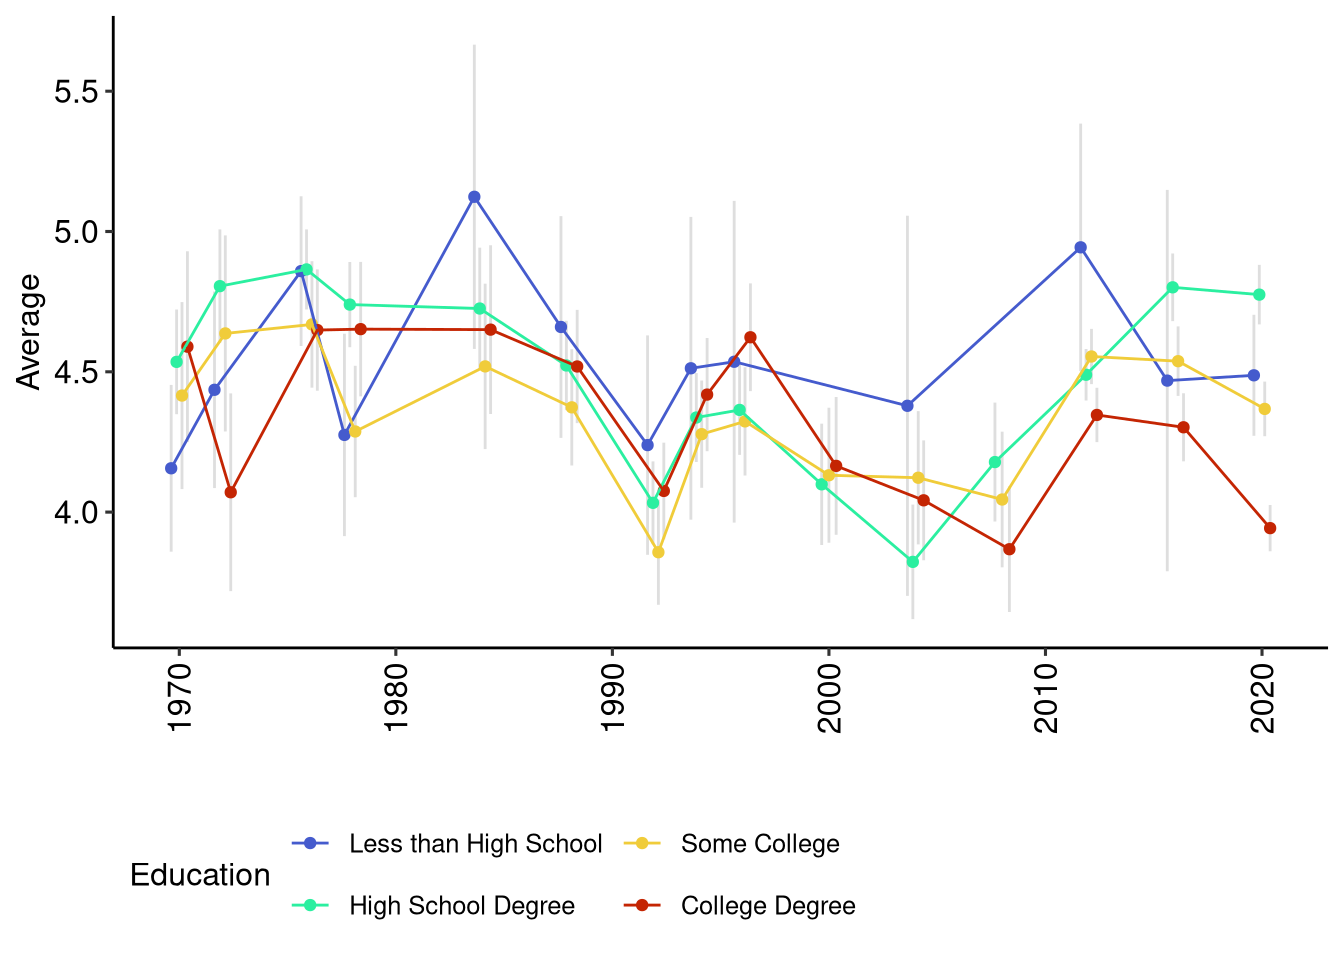
By Education
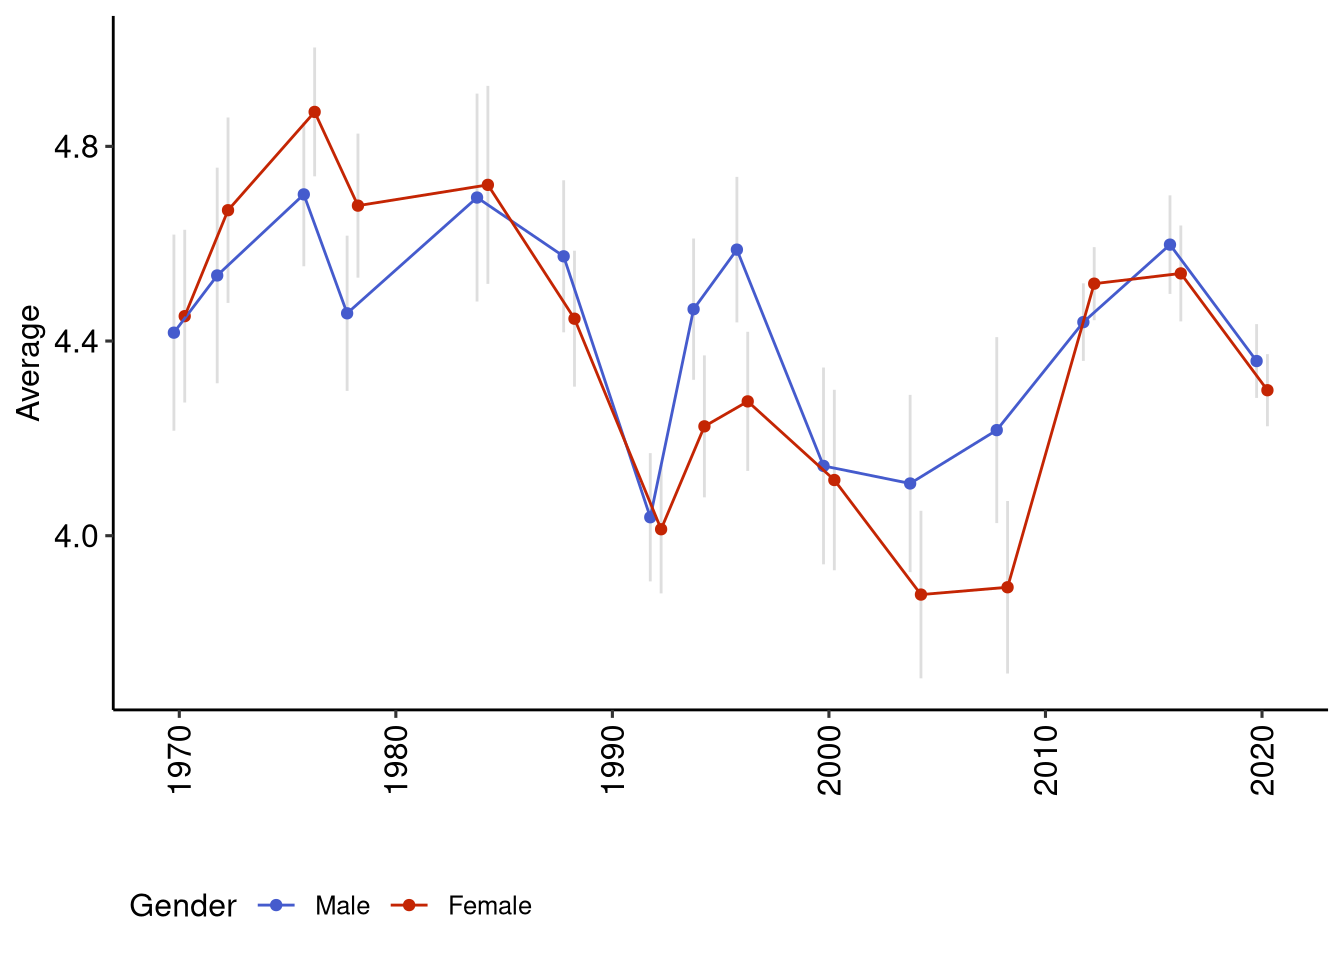
By Gender
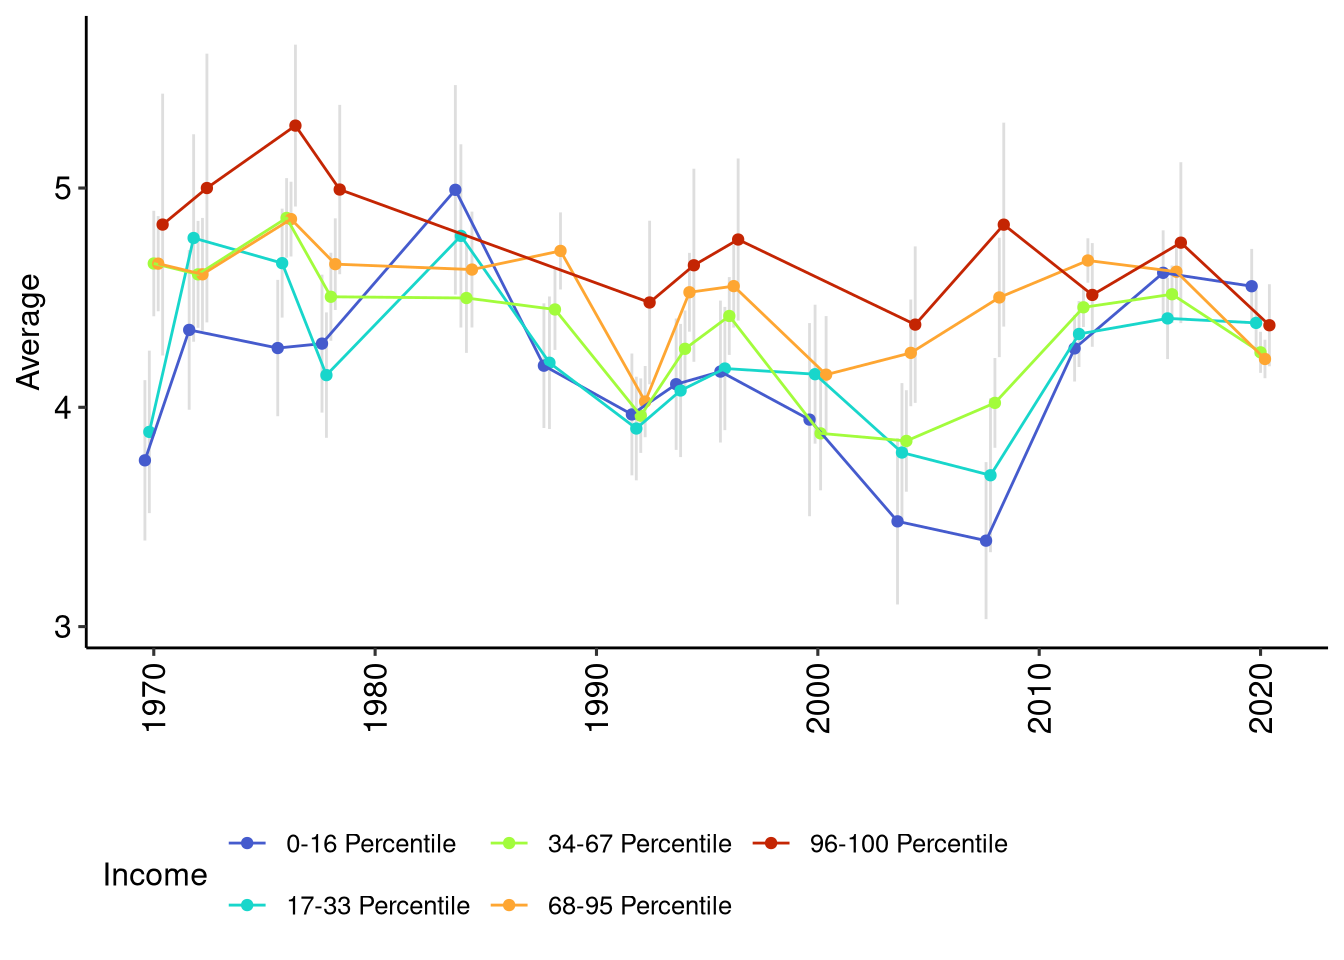
By Income
By Party
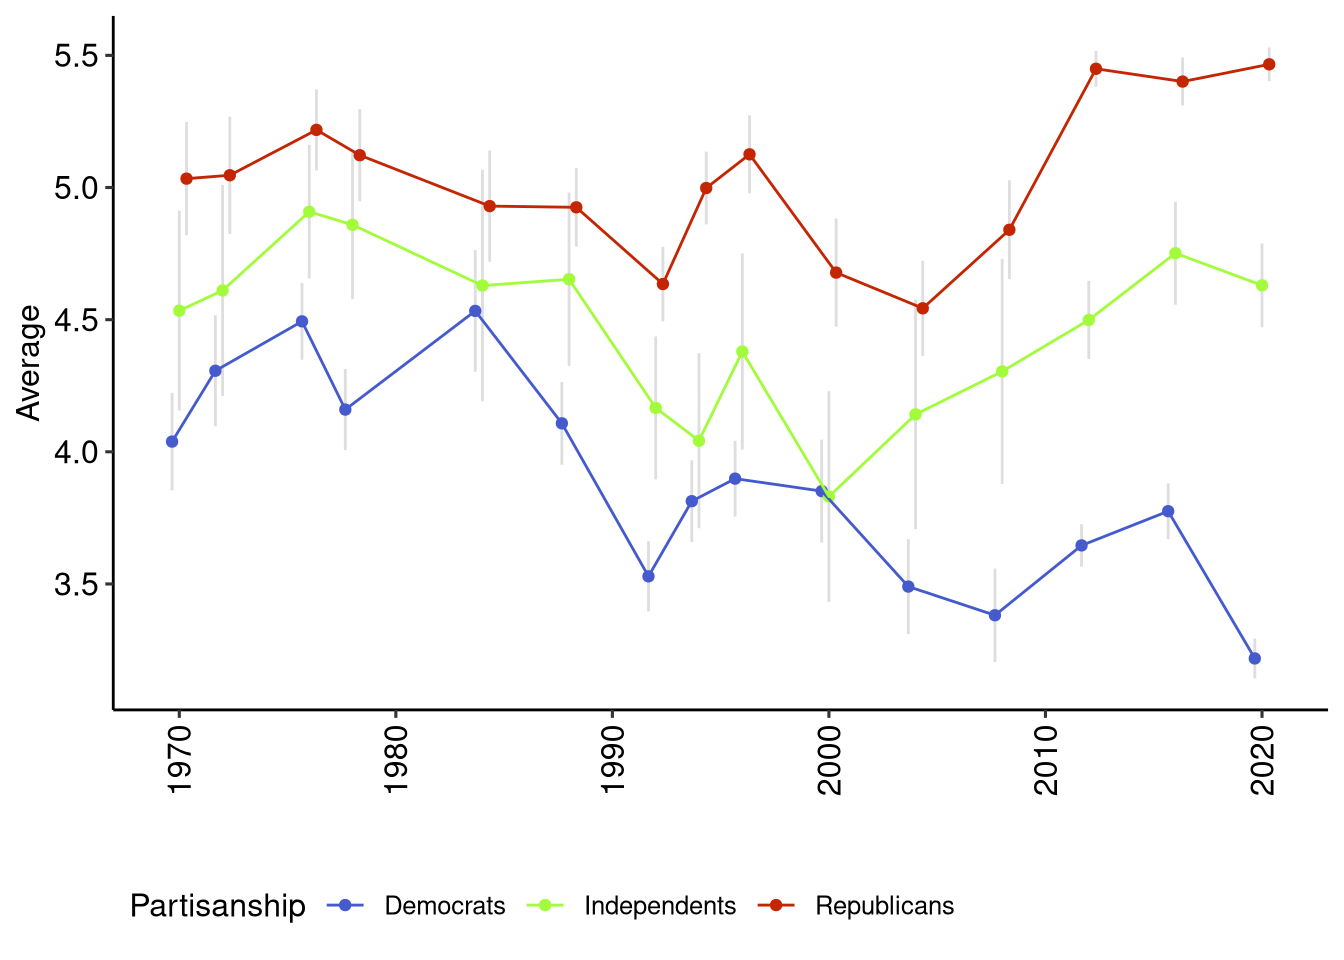
Note: This includes “leaners” in the party they lean towards. Individuals were first asked whether they think of themselves as a Republican, Democrat or Independent. Those who identify as Independent are then asked if they lean towards one party or the other.
By Race
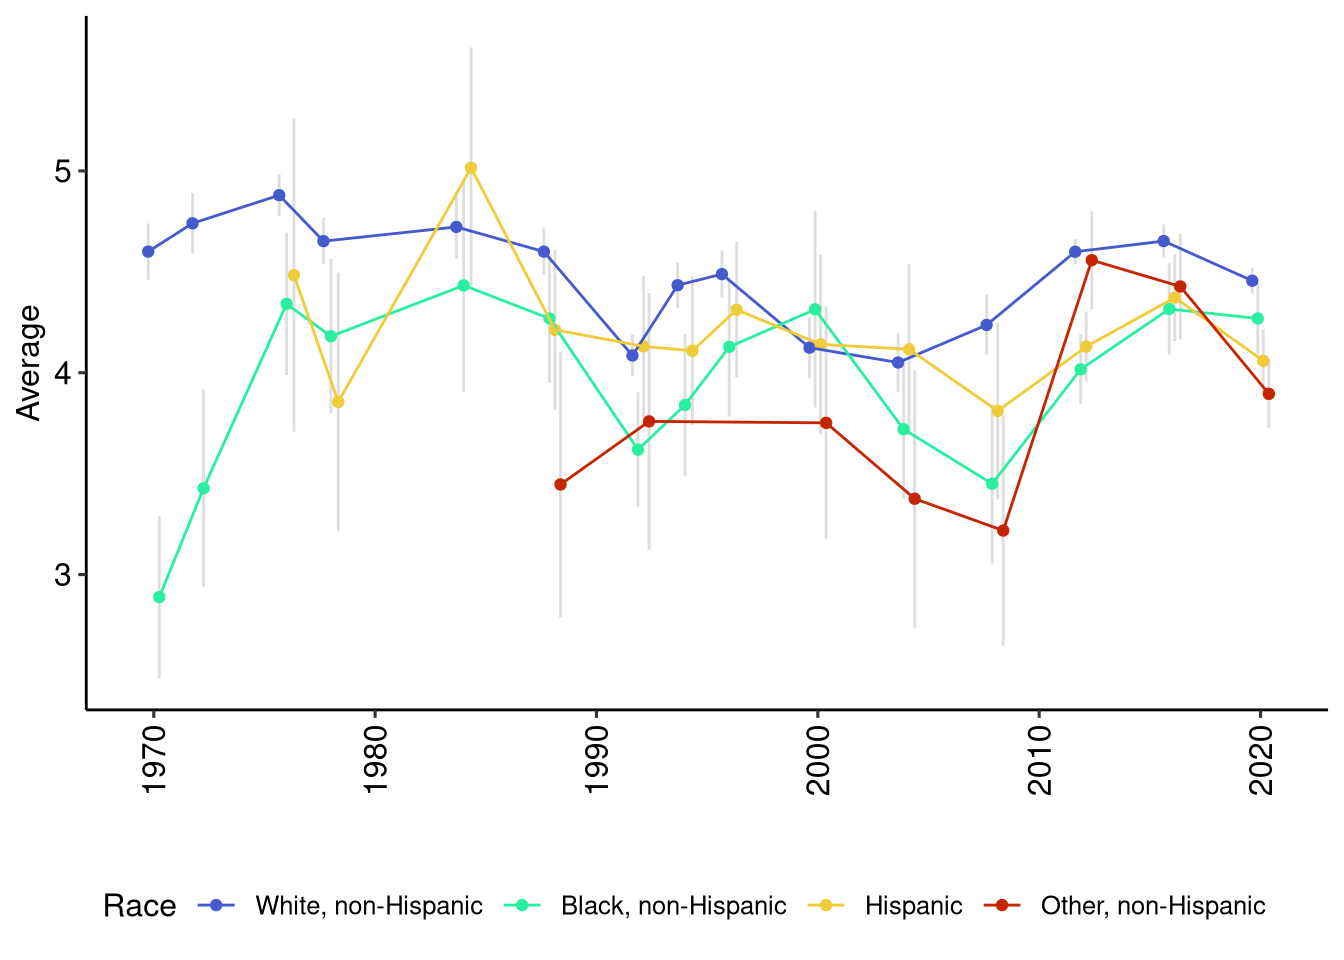
Note: Options for race have varied significantly overtime, and the size of the ANES means that there are very small samples Asian and American Indian. Because of this they are grouped together into “Other, non-Hispanic” which also includes those who identify as multiple racial categories. I also drop any years where there are fewer than 50 individuals in the sample. This is far from ideal.
By Subjective Class
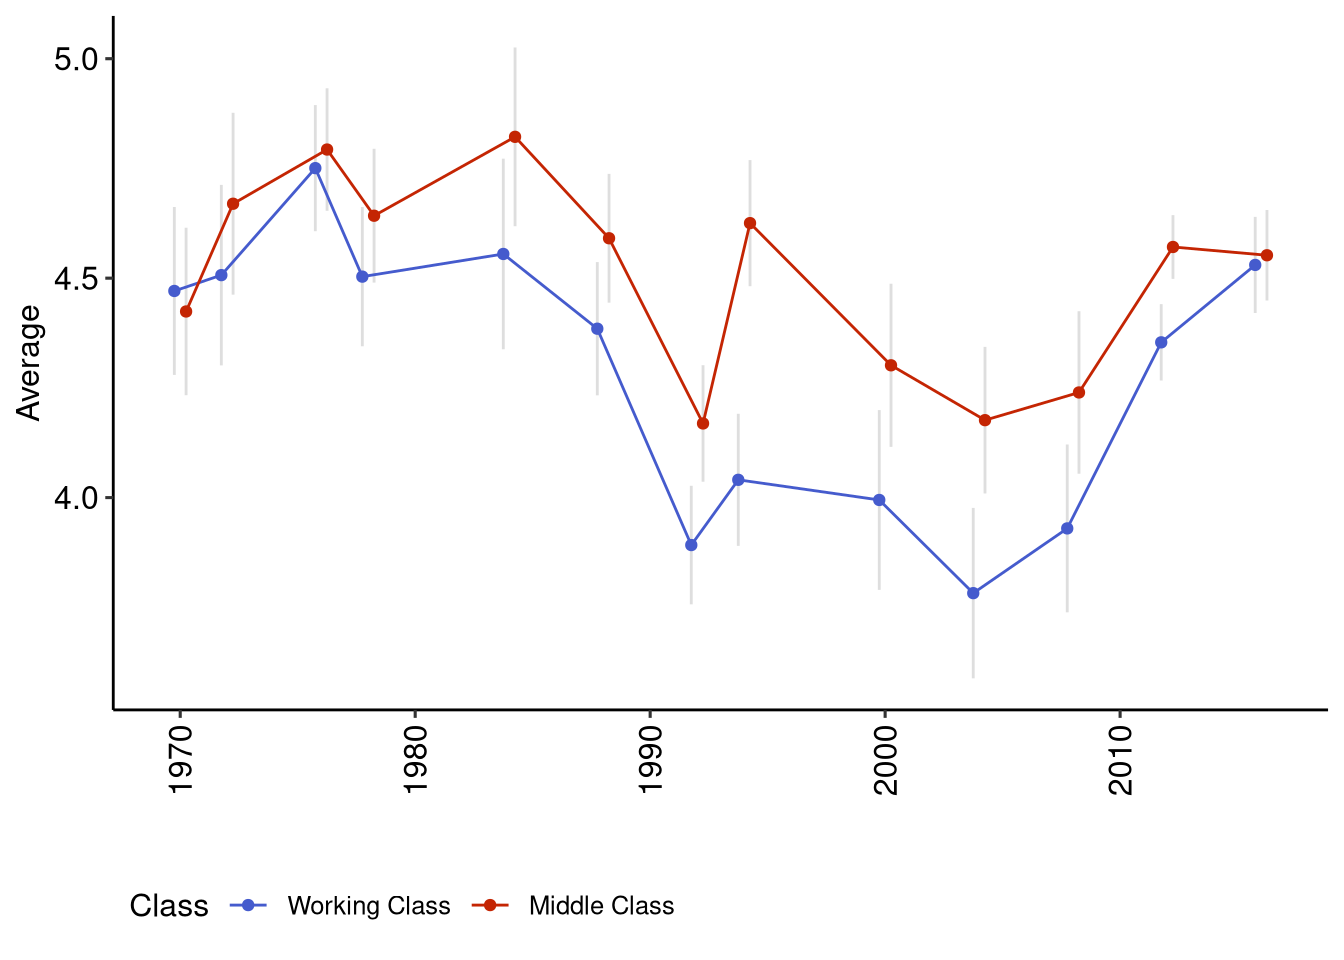
Subjective class is what an individual identifies as when asked. The question used by ANES is:
There’s been some talk these days about different social classes. Most people say they belong either to the middle class or the working class. Do you ever think of yourself as belonging in one of these classes? Which one?
In some years respondents were asked where they identified within “working” or “middle” but not consistently so that has been dropped from this analysis.
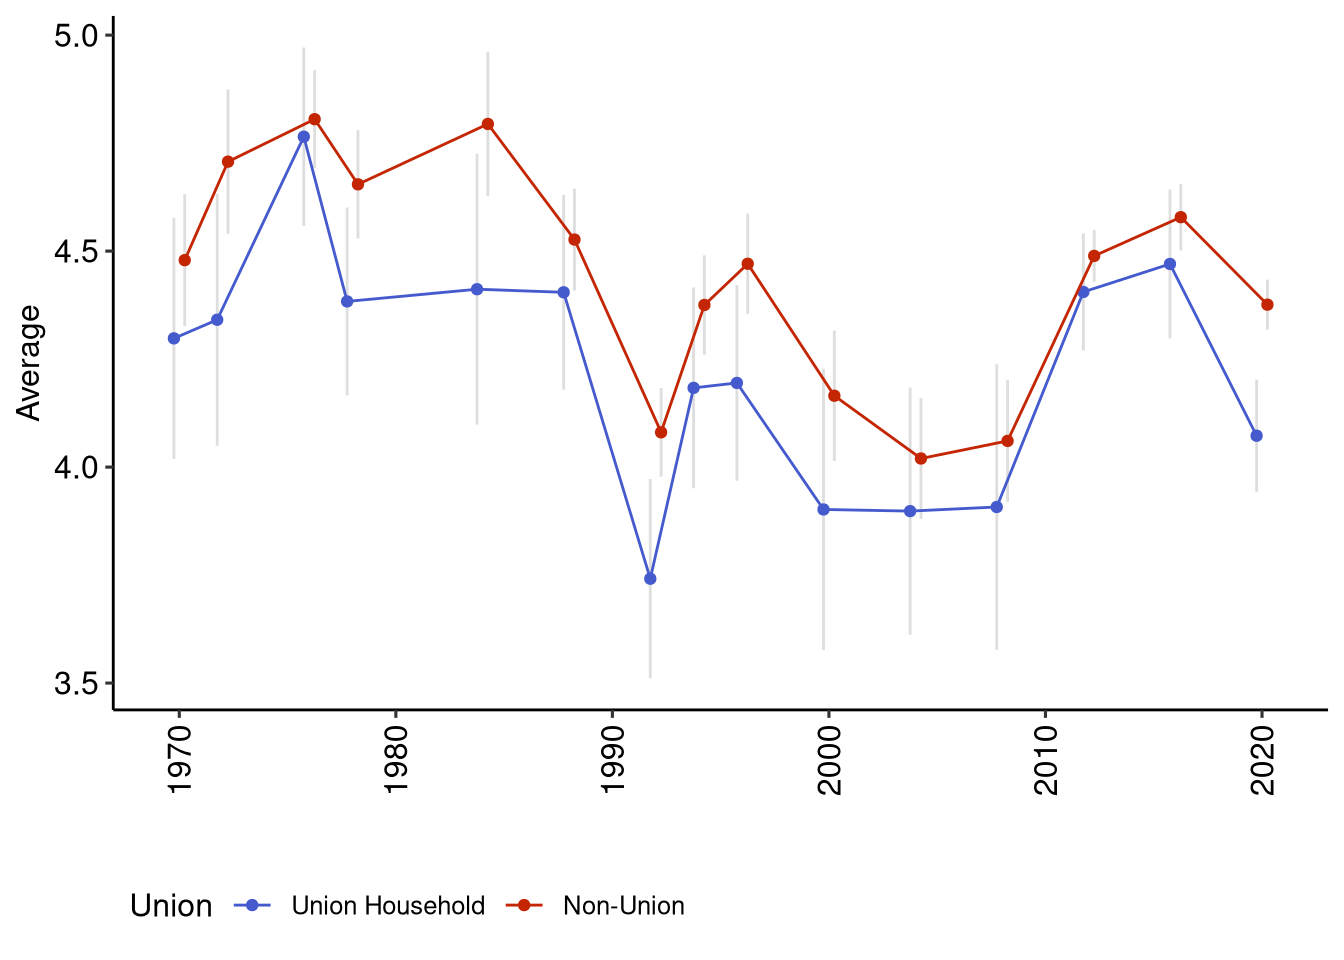
By Union Status
Data
The summary statistics are available here. The Group N column is the number of respondents in a given group in a given year while the N column is the number of respondents who selected the answer in the Gov Healthcare column.
Note: These are all weighted statistics (using the VCF0009z weights) and are provided if you’d like to make you own visualizations. If you are interested in doing your own analysis, use the raw data available from the American National Election Studies survey.