Don’t Have a Say In Government
Question Language
1952-1980,1982,1992: Now I’d like to read some of the kinds of things people tell us when we interview them. Please tell me whether (1992: and ask you whether) (1966,1988,1990,1994-LATER: how much) you agree or disagree with these statements (1992: with them) (2002: about the government.) (1988,1990: You can just give me the number of your choice.) (1992: I’ll read them one at a time and you just tell me whether you agree or disagree) (1996 and later: The first is:)
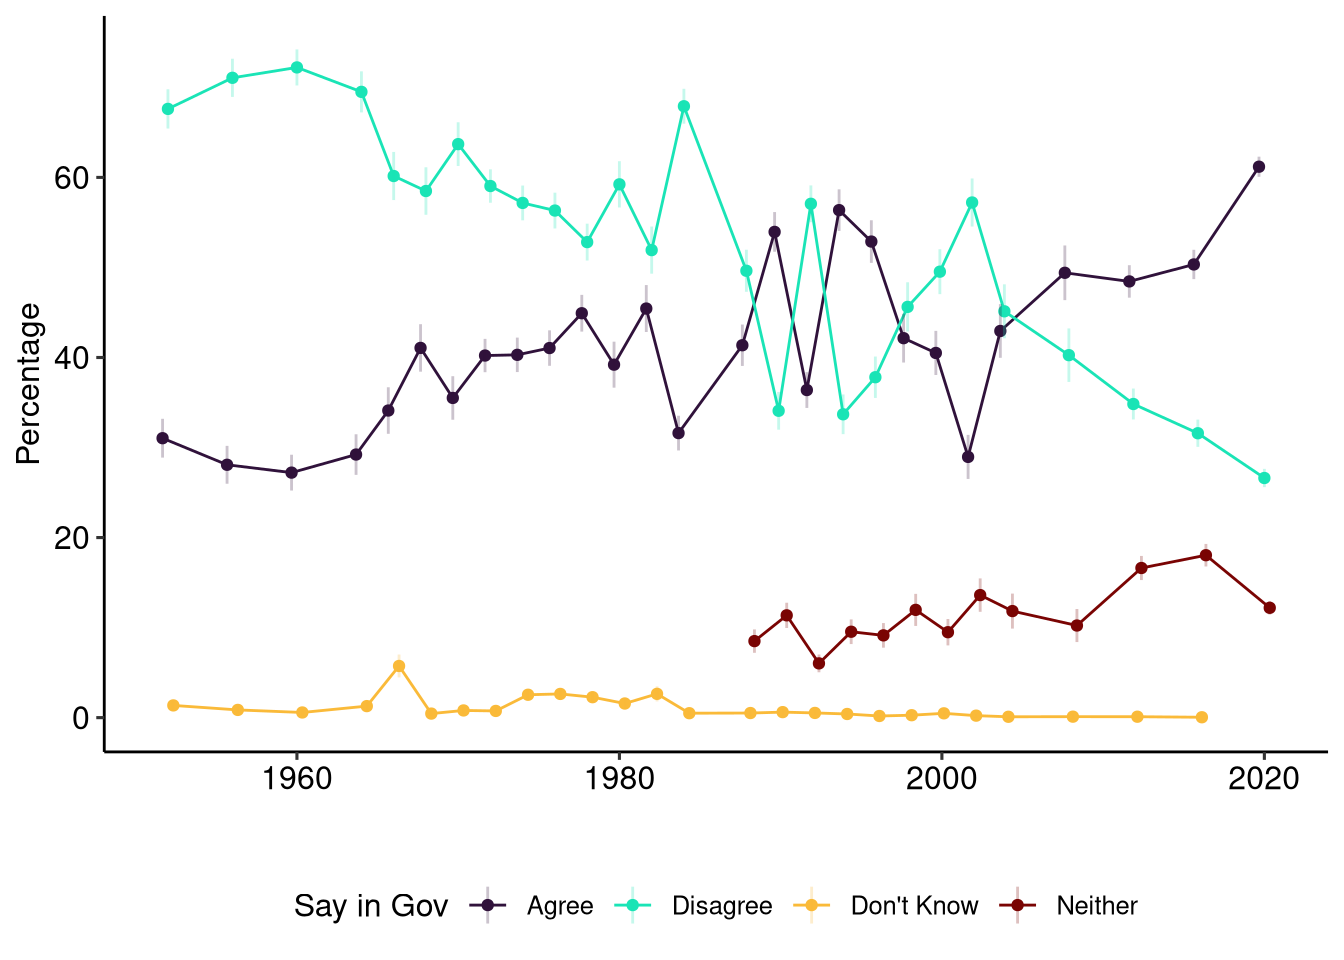
“People like me don’t have any say about what the government does”
2000 TELEPHONE,2002: Do you agree, neither agree nor disagree, or disagree with this statement?
- Agree
- Disagree
- Neither agree nor disagree (1988 and later only)
- DK; not sure; it depends; can’t say; refused to sa
All
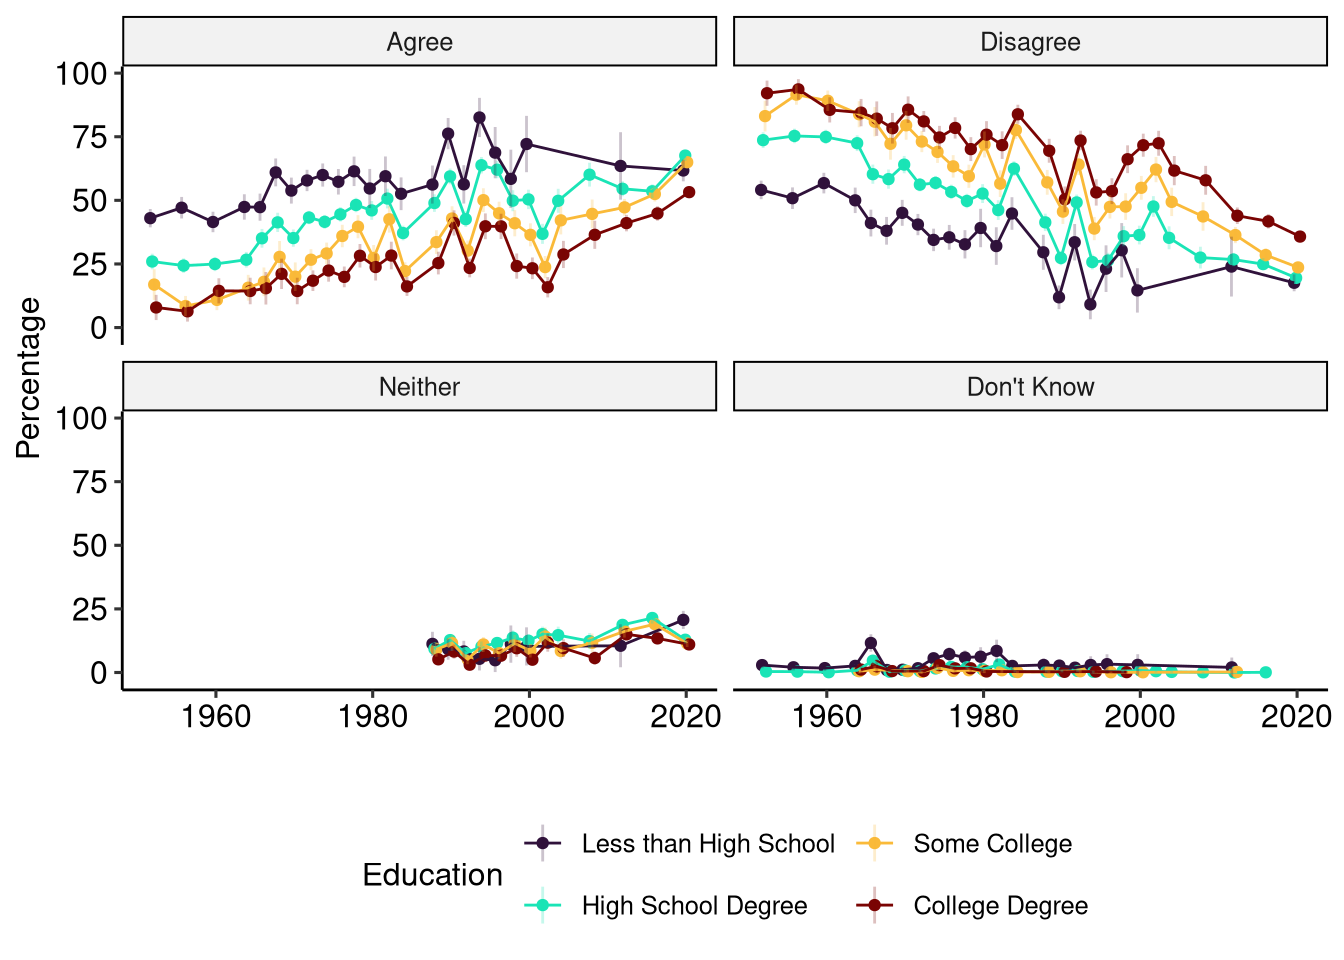
By Education
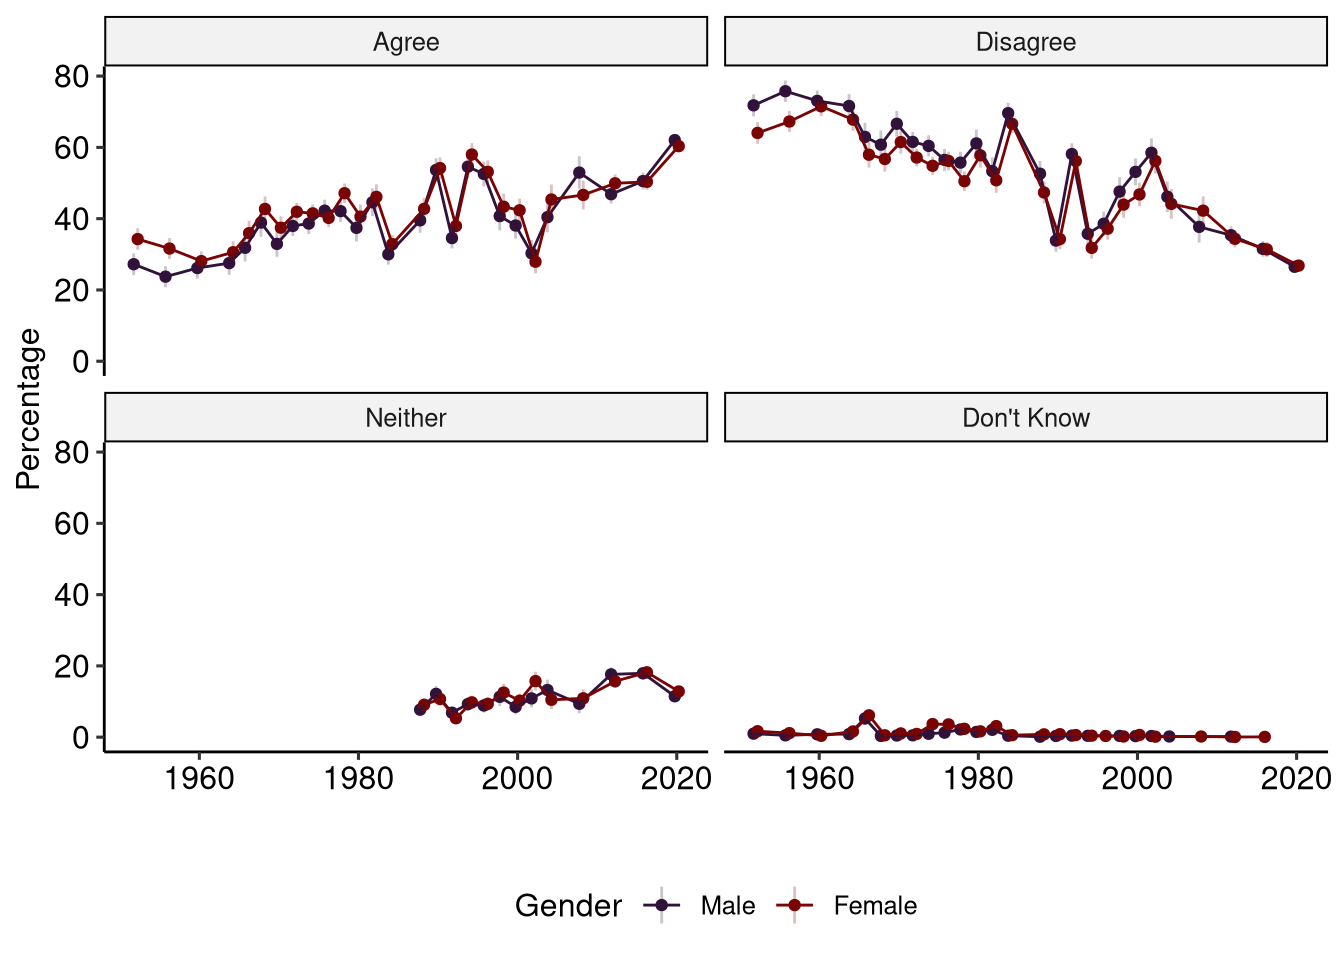
By Gender
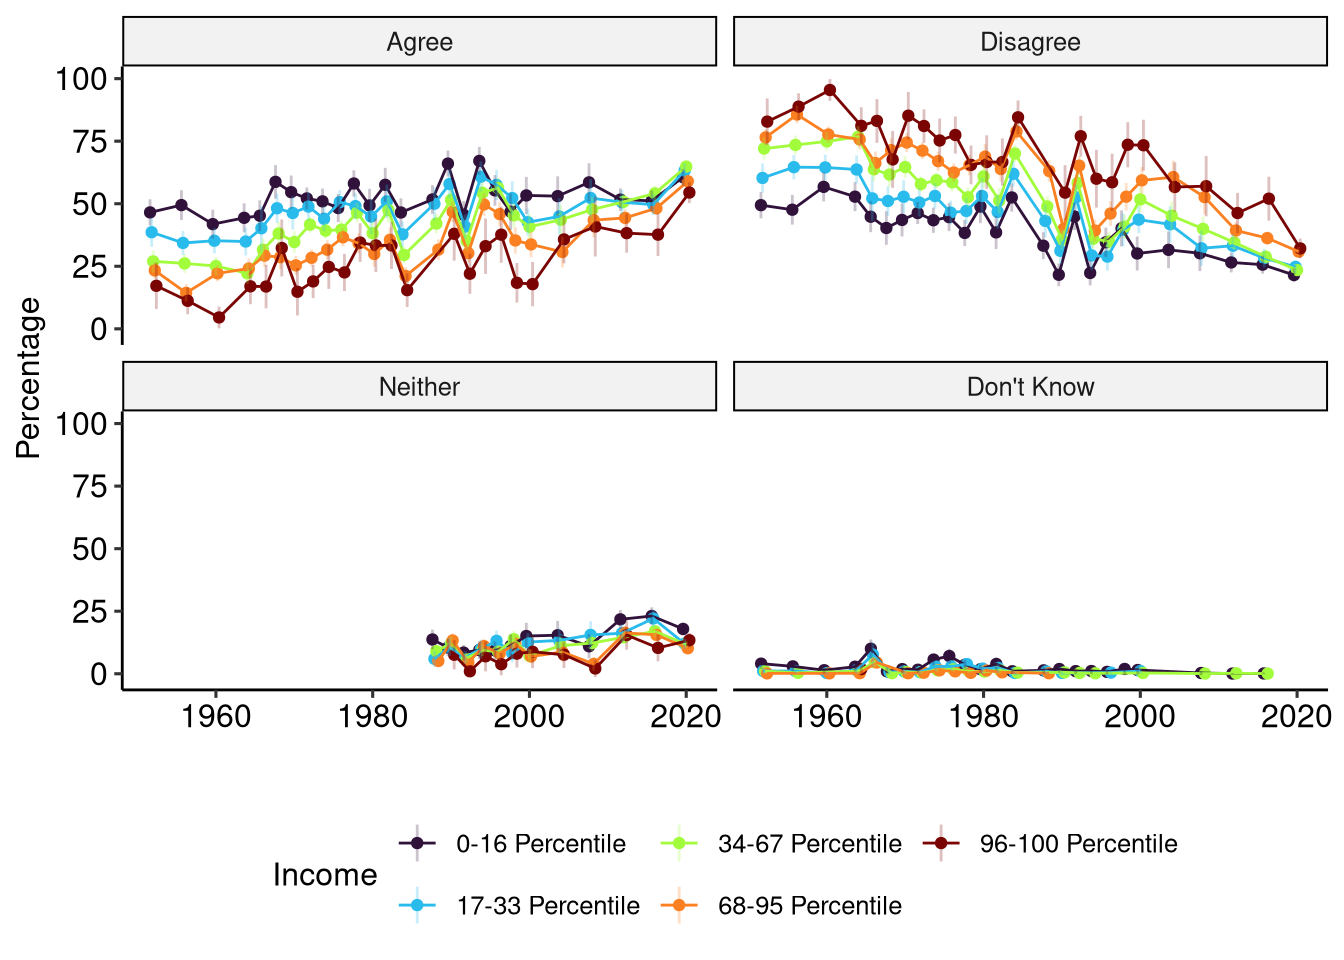
By Income
By Race
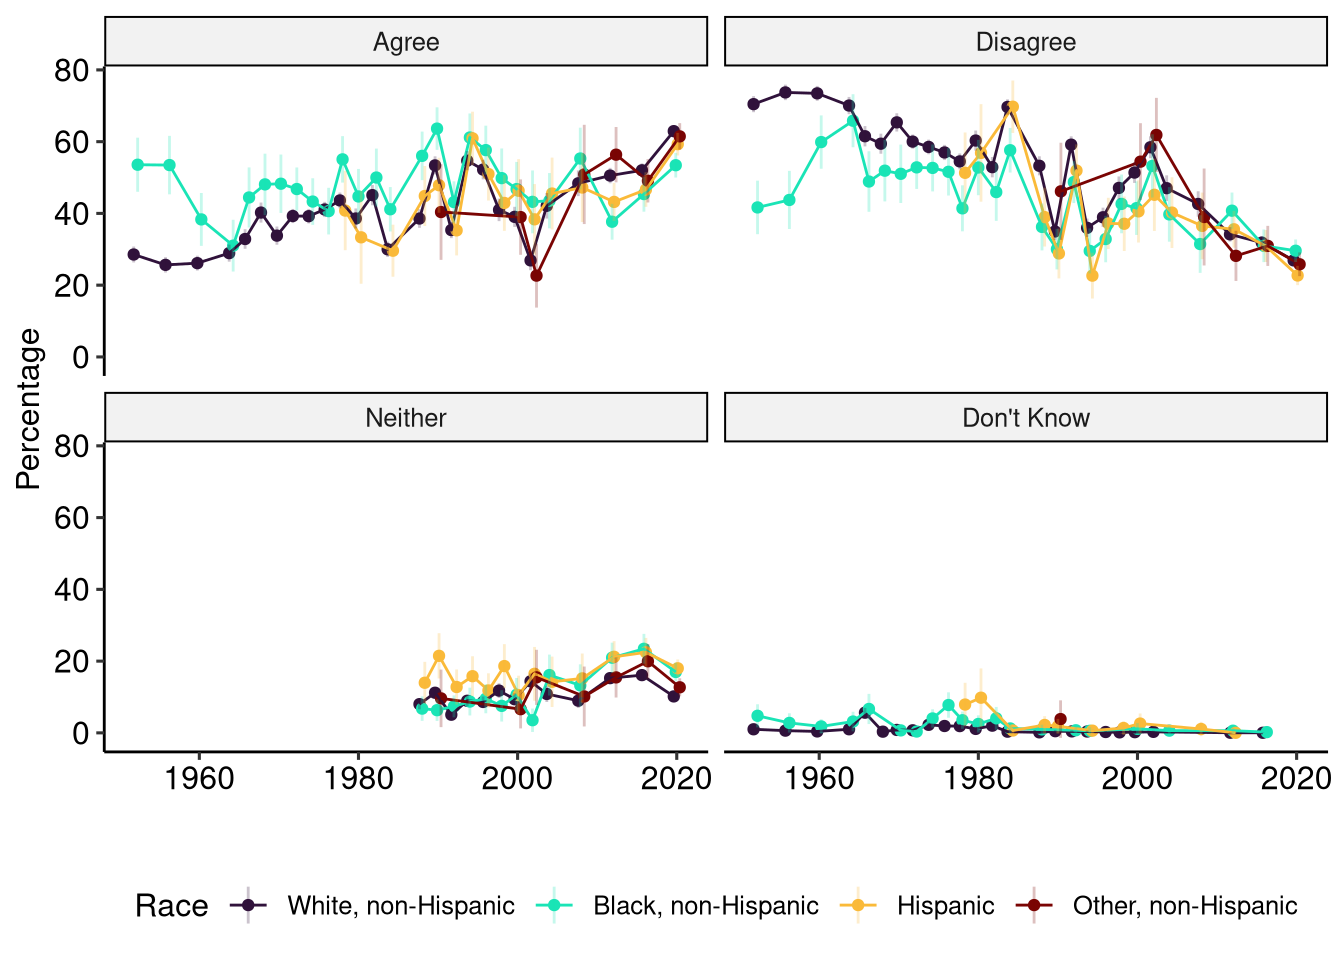
Note: Options for race have varied significantly overtime, and the size of the ANES means that there are very small samples Asian and American Indian. Because of this they are grouped together into “Other, non-Hispanic” which also includes those who identify as multiple racial categories. I also drop any years where there are fewer than 50 individuals in the sample. This is far from ideal.
By Subjective Class
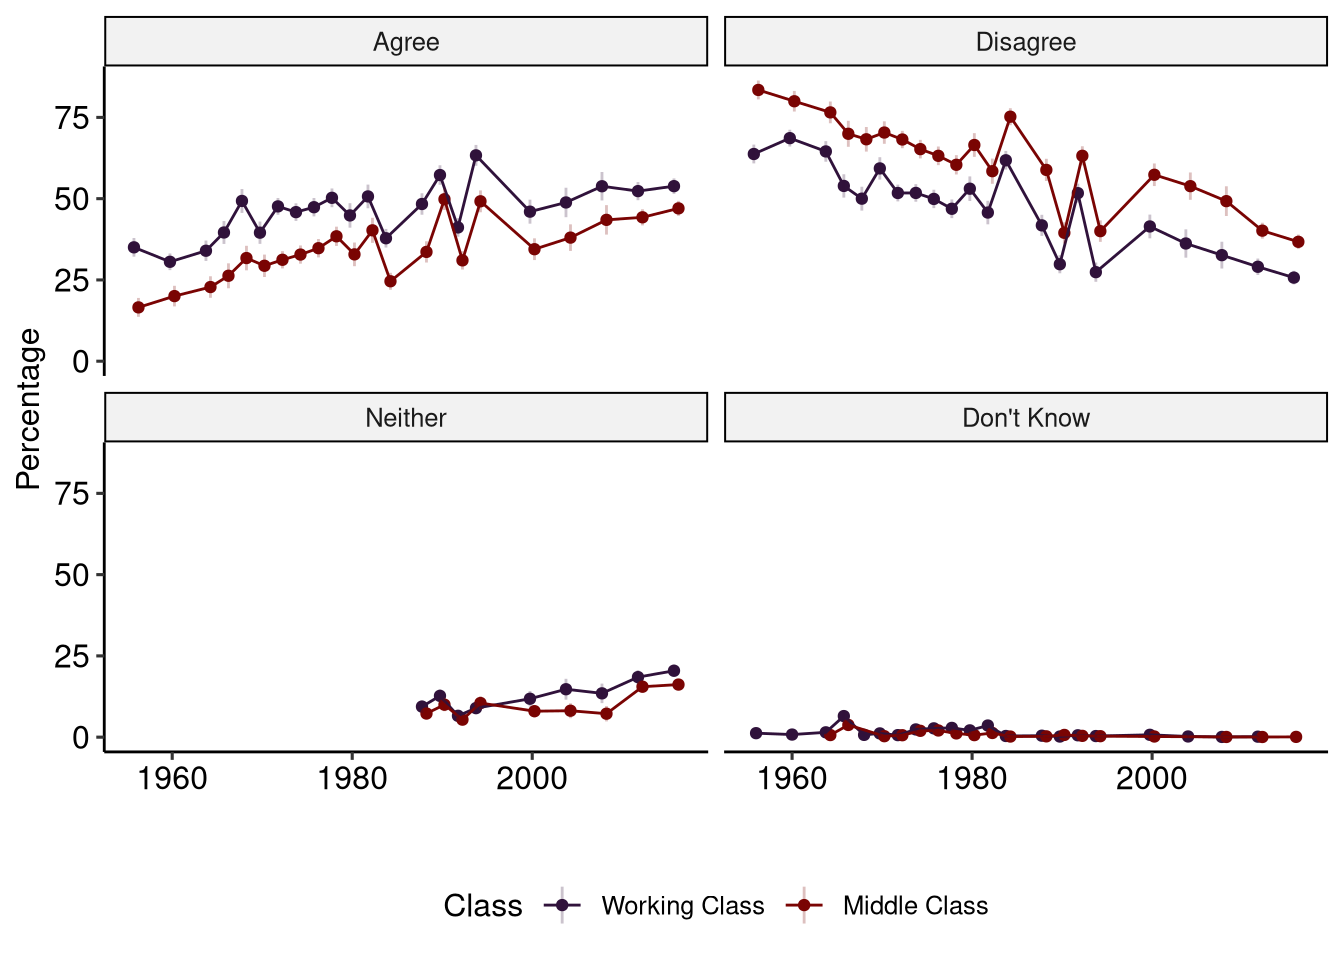
Subjective class is what an individual identifies as when asked. The question used by ANES is:
There’s been some talk these days about different social classes. Most people say they belong either to the middle class or the working class. Do you ever think of yourself as belonging in one of these classes? Which one?
In some years respondents were asked where they identified within “working” or “middle” but not consistently so that has been dropped from this analysis.
By Party
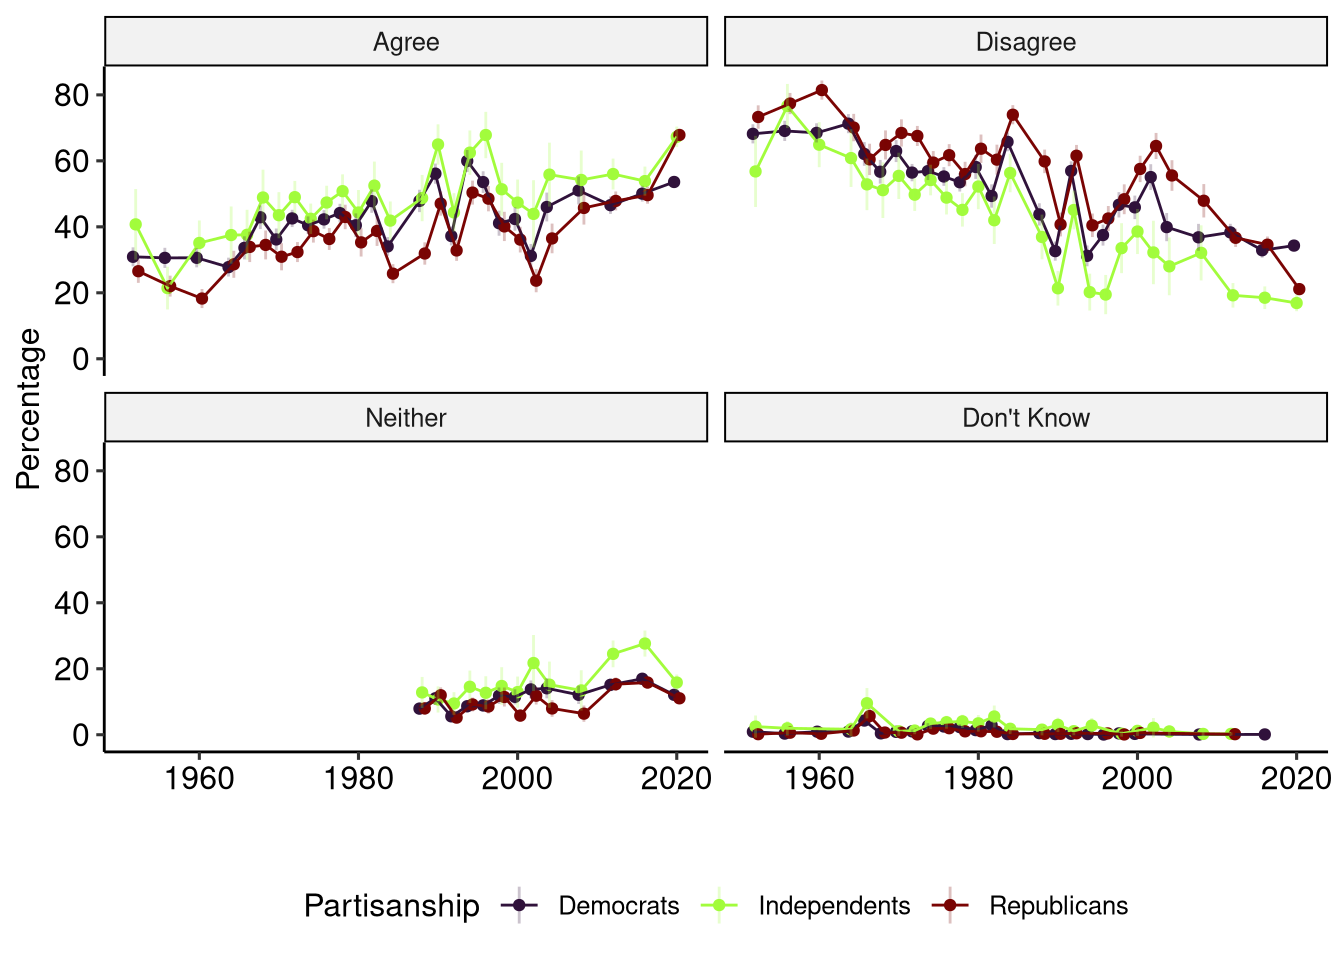
Note: This includes “leaners” in the party they lean towards. Individuals were first asked whether they think of themselves as a Republican, Democrat or Independent. Those who identify as Independent are then asked if they lean towards one party or the other.
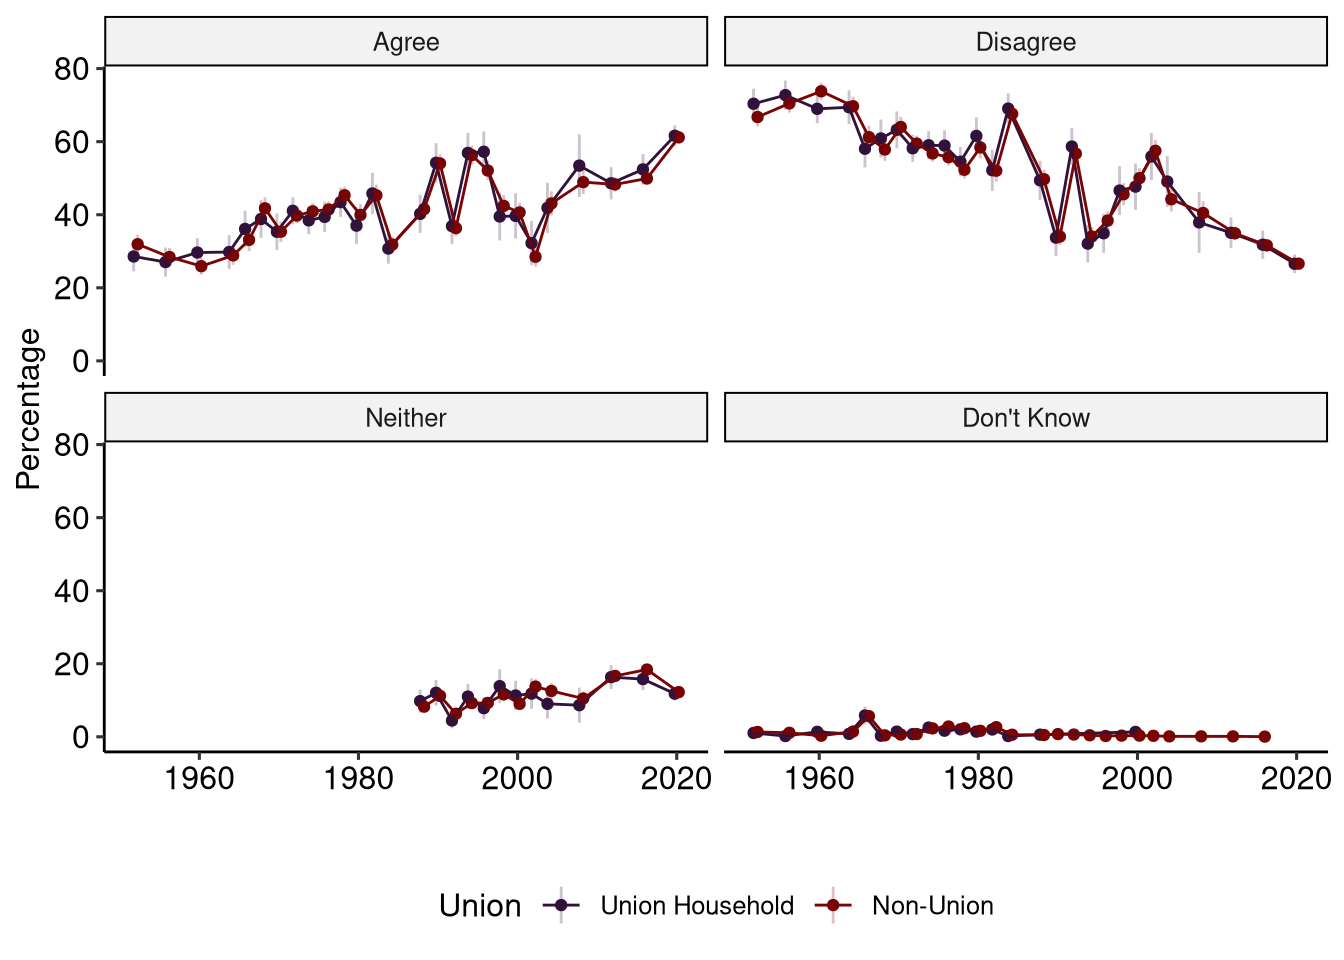
By Union Status
Data
The summary statistics are available here. The Group N column is the number of respondents in a given group in a given year while the N column is the number of respondents who selected the answer in the Say in Gov column.
Note: These are all weighted statistics (using the VCF0009z weights) and are provided if you’d like to make you own visualizations. If you are interested in doing your own analysis, use the raw data available from the American National Election Studies survey.