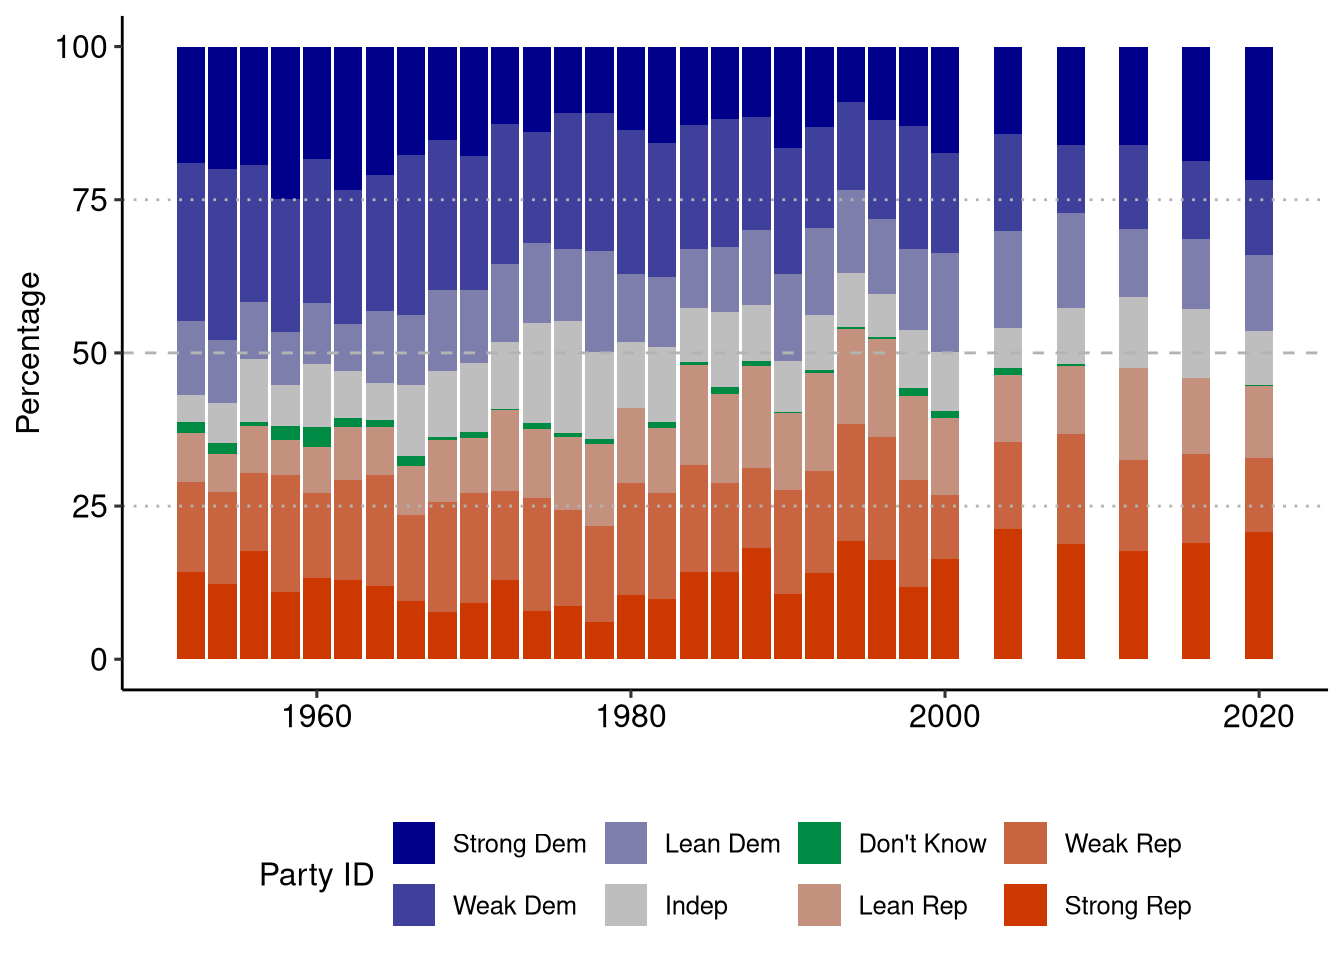
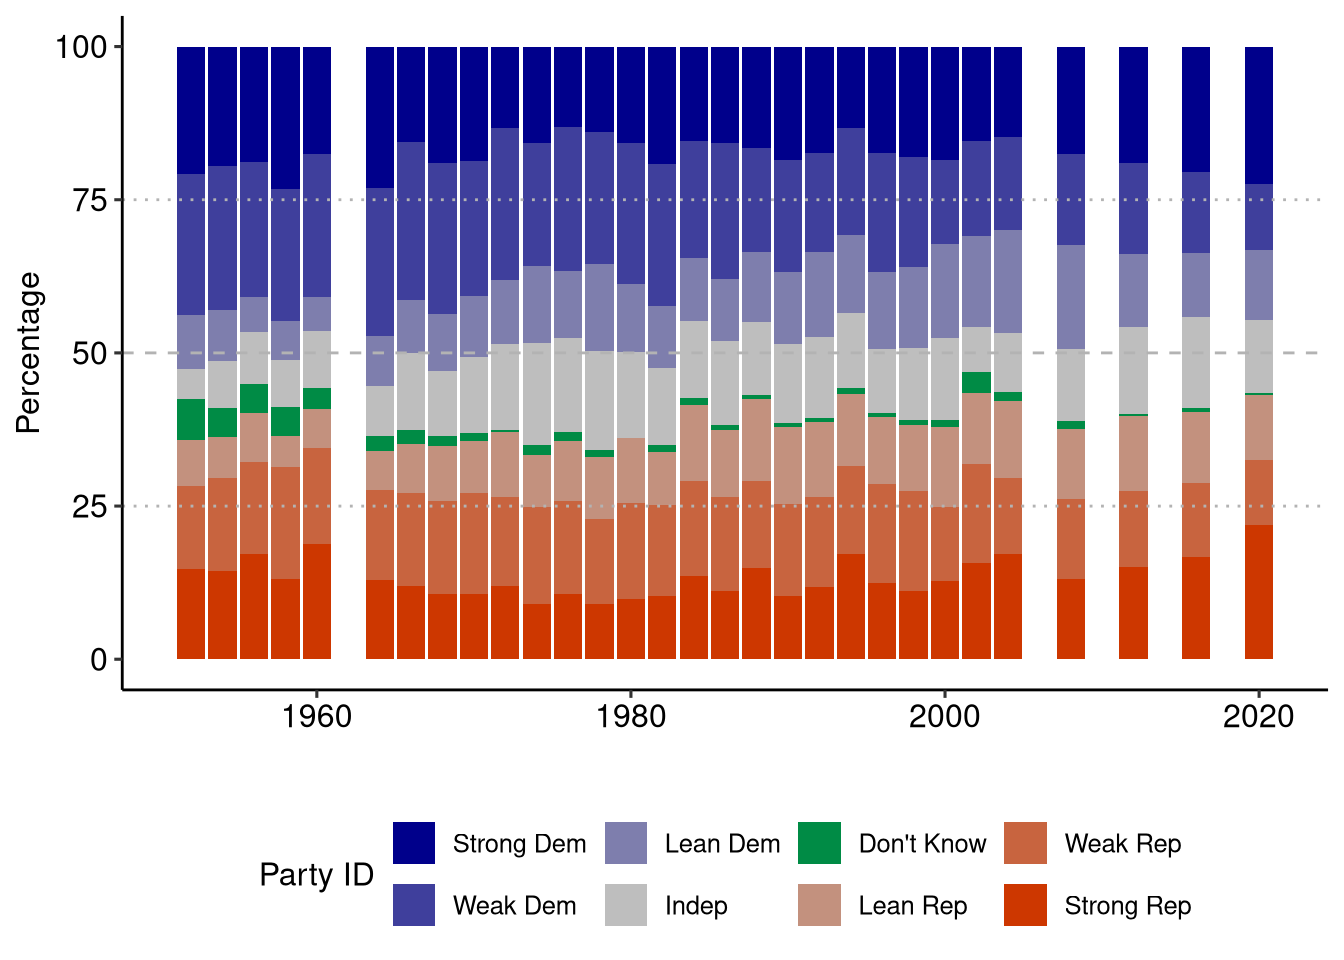
Partisan Identification
Generally speaking, do you usually think of yourself as a Republican, a Democrat, an Independent, or what? (IF REPUBLICAN OR DEMOCRAT) Would you call yourself a strong (REP/DEM) or a not very strong (REP/DEM)? (IF INDEPENDENT, OTHER [1966 AND LATER:] OR NO PREFERENCE; 2008: OR DK) Do you think of yourself as closer to the Republican or Democratic party?
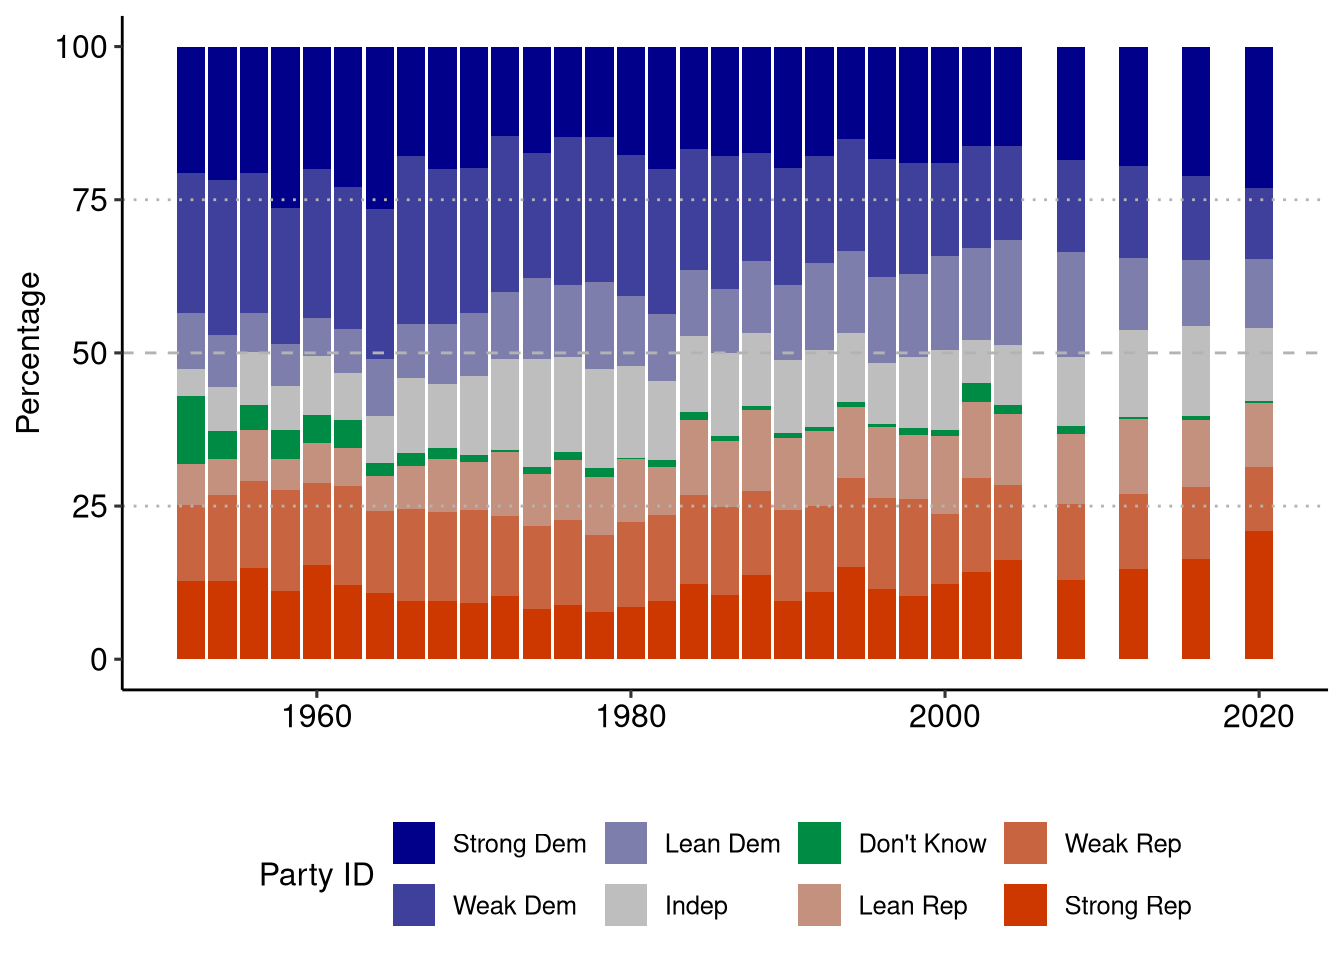
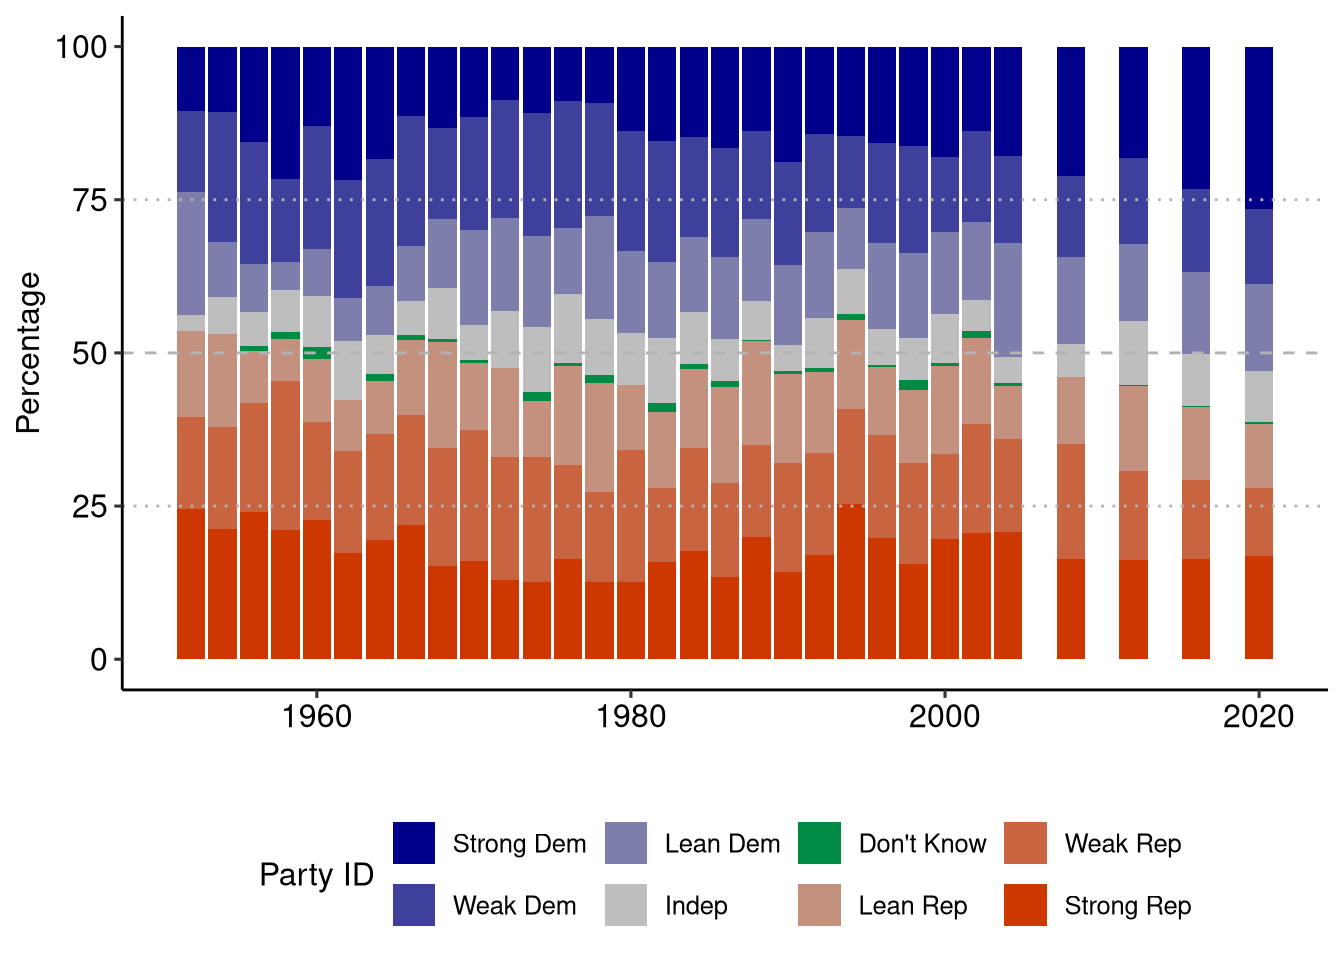
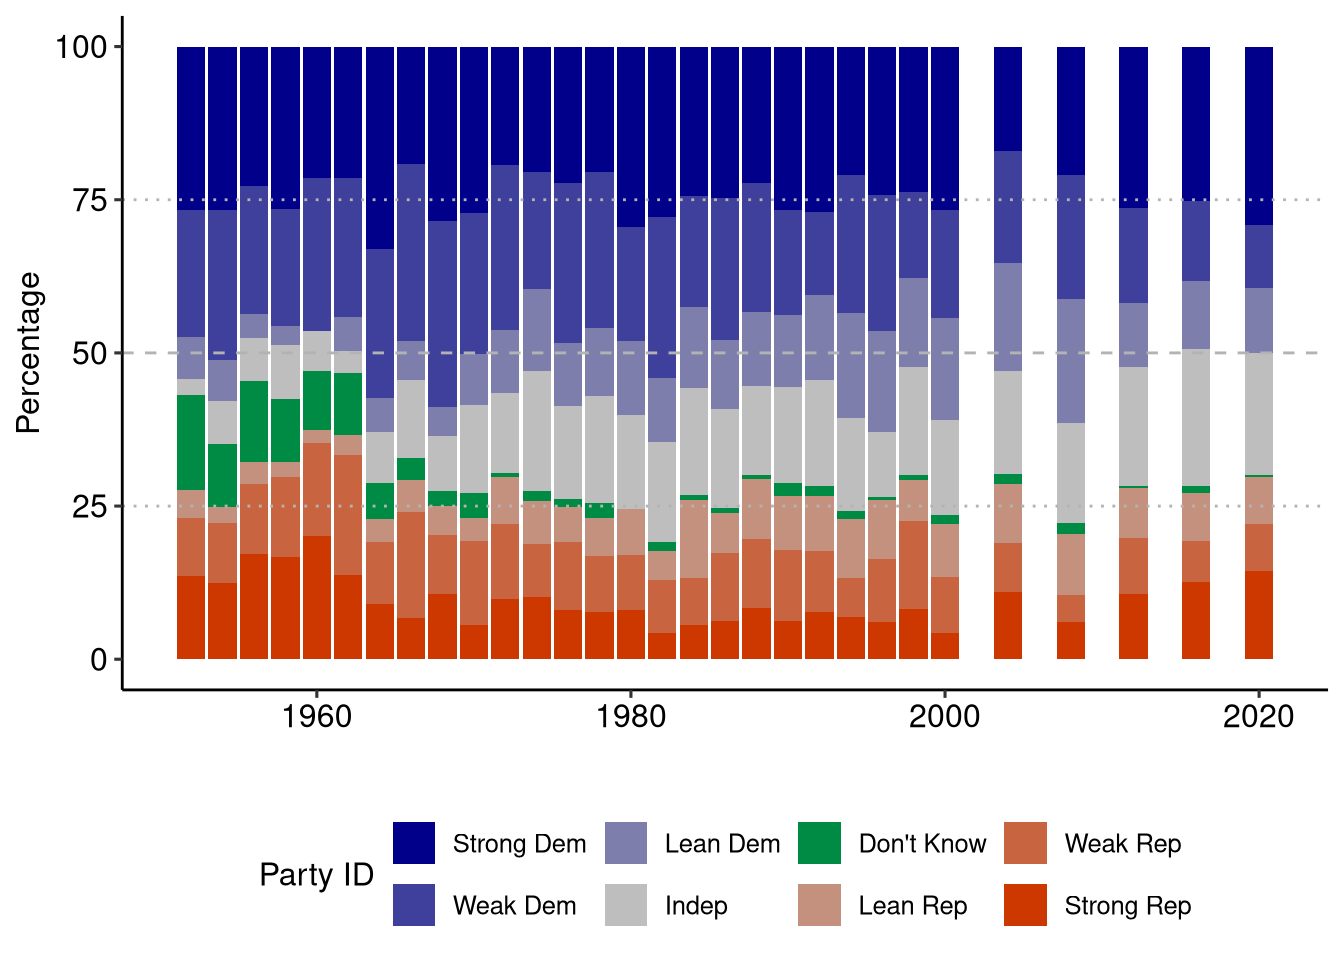
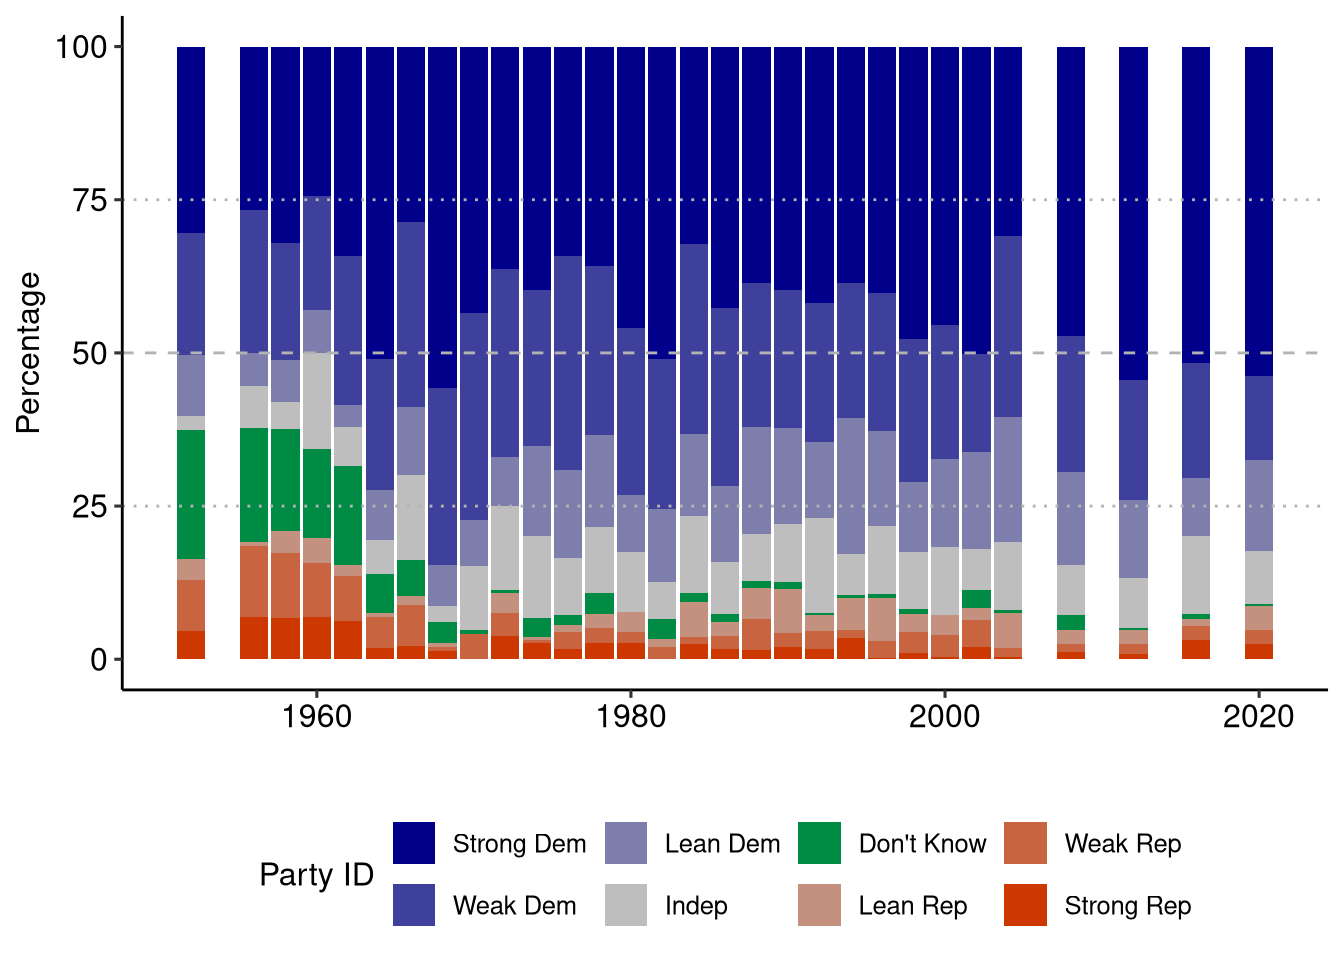
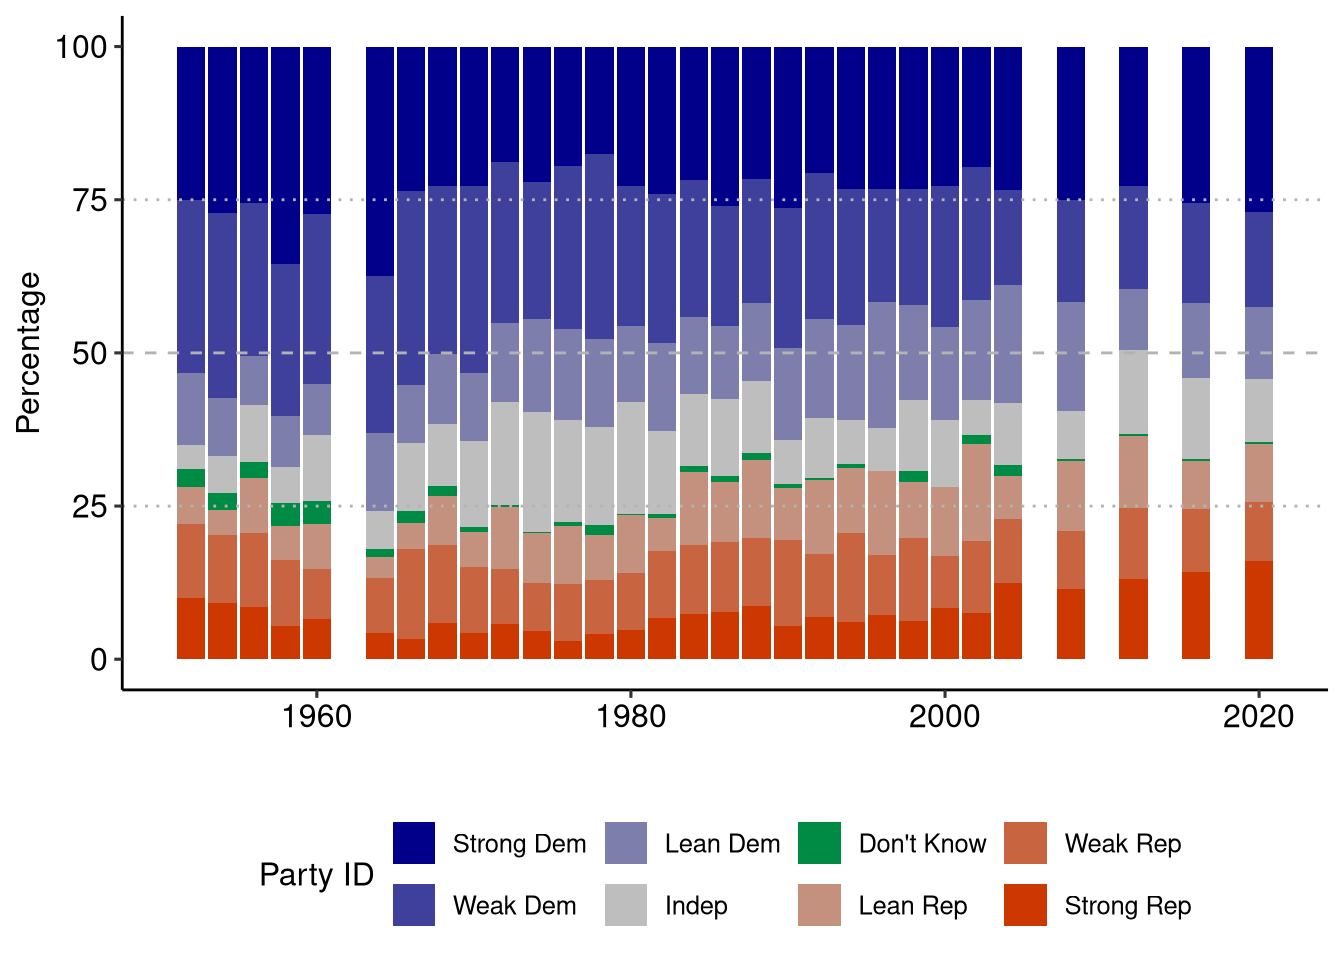
Overall Trend
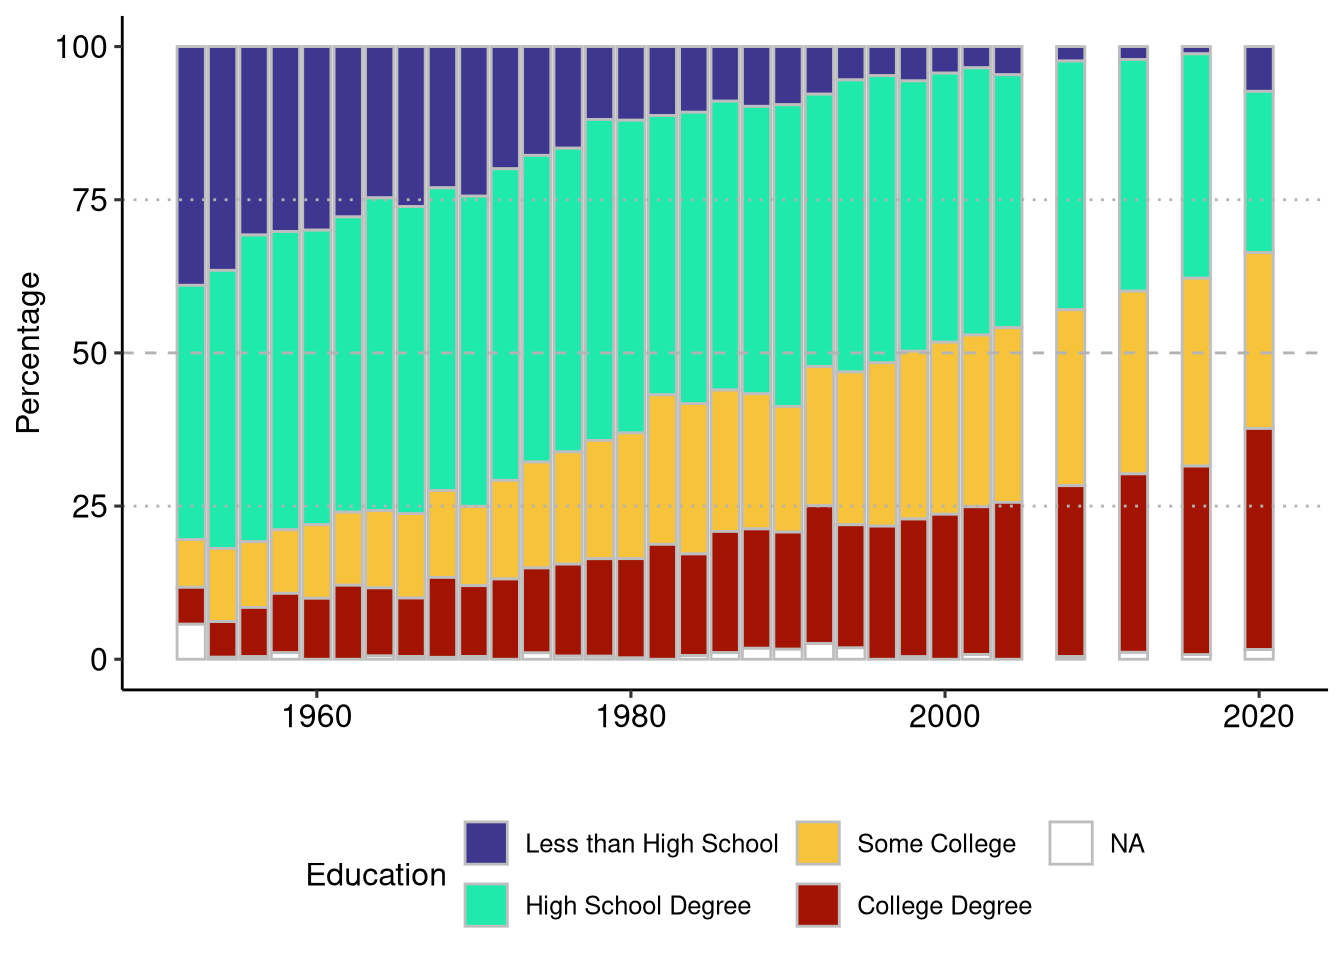
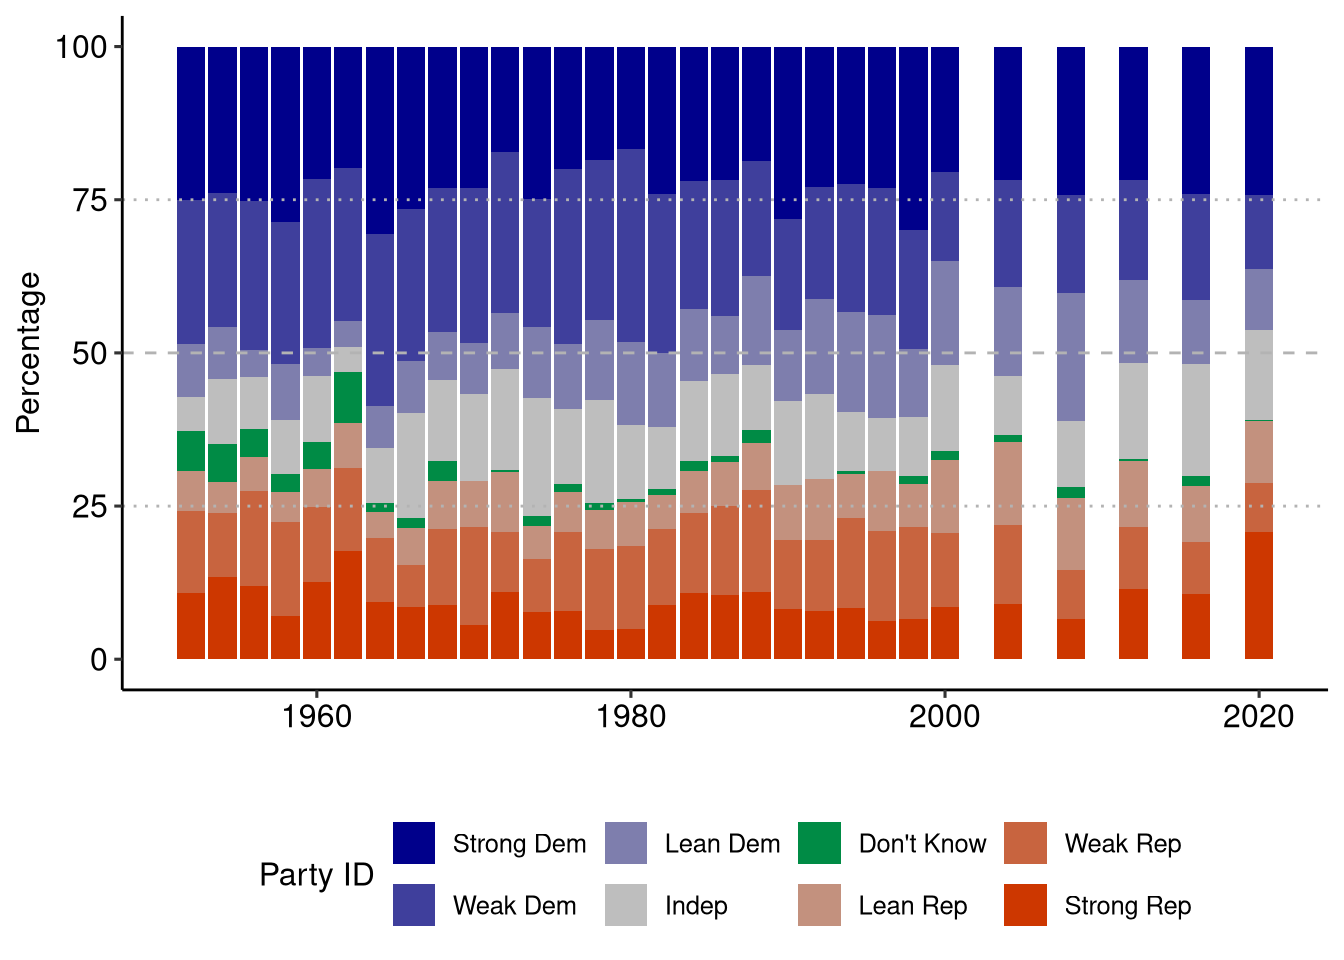
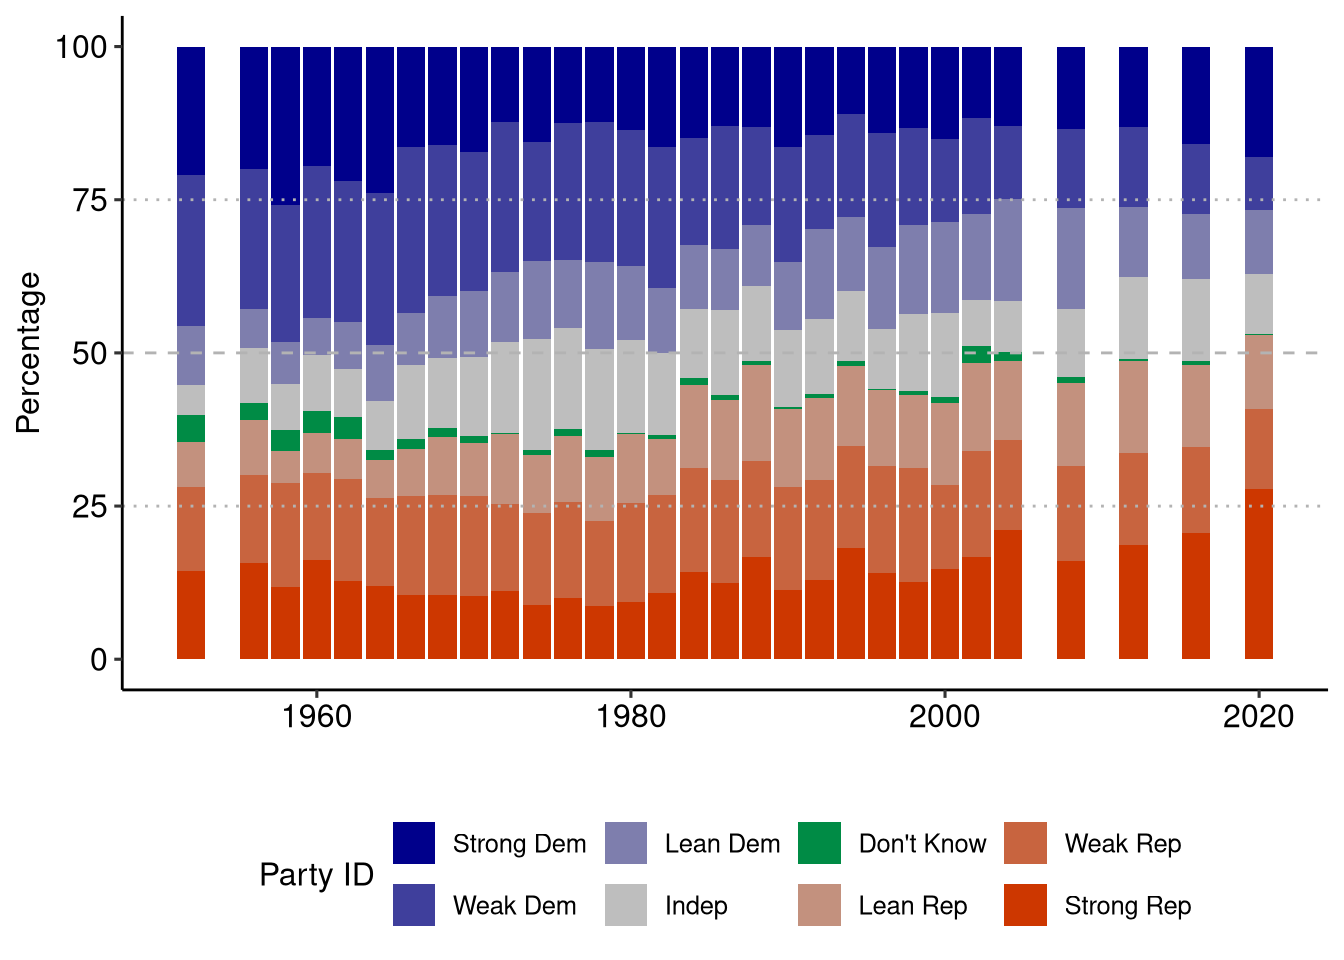
By Education
The summary statistics are available here. The Group N column is the number of respondents in a given group in a given year while the N column is the number of respondents who selected the answer in the Party column.
Note: These are all weighted statistics (using the VCF0009z weights) and are provided if you’d like to make you own visualizations. If you are interested in doing your own analysis, use the raw data available from the American National Election Studies survey.
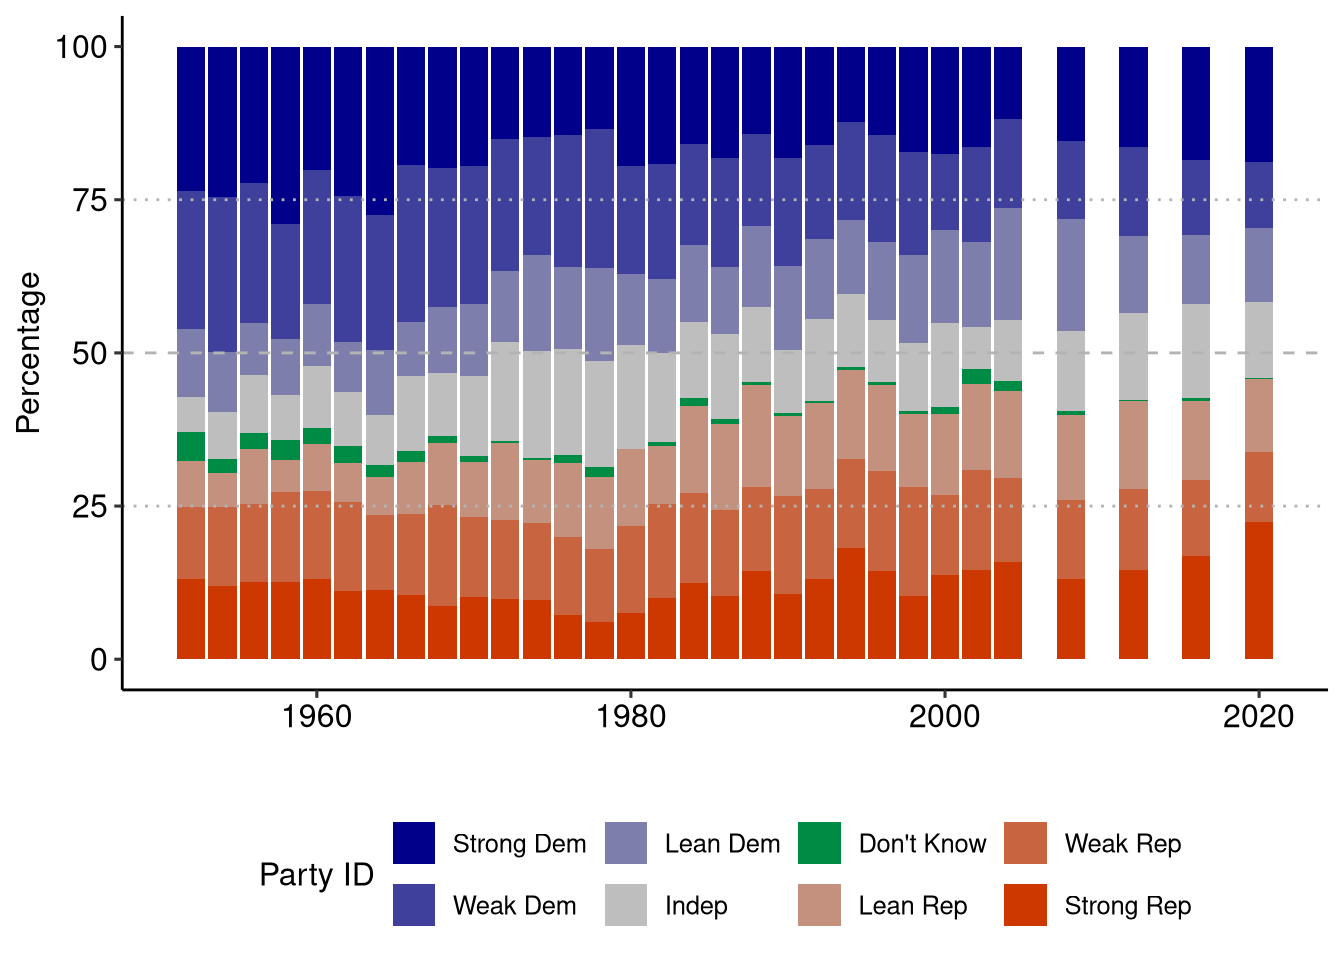
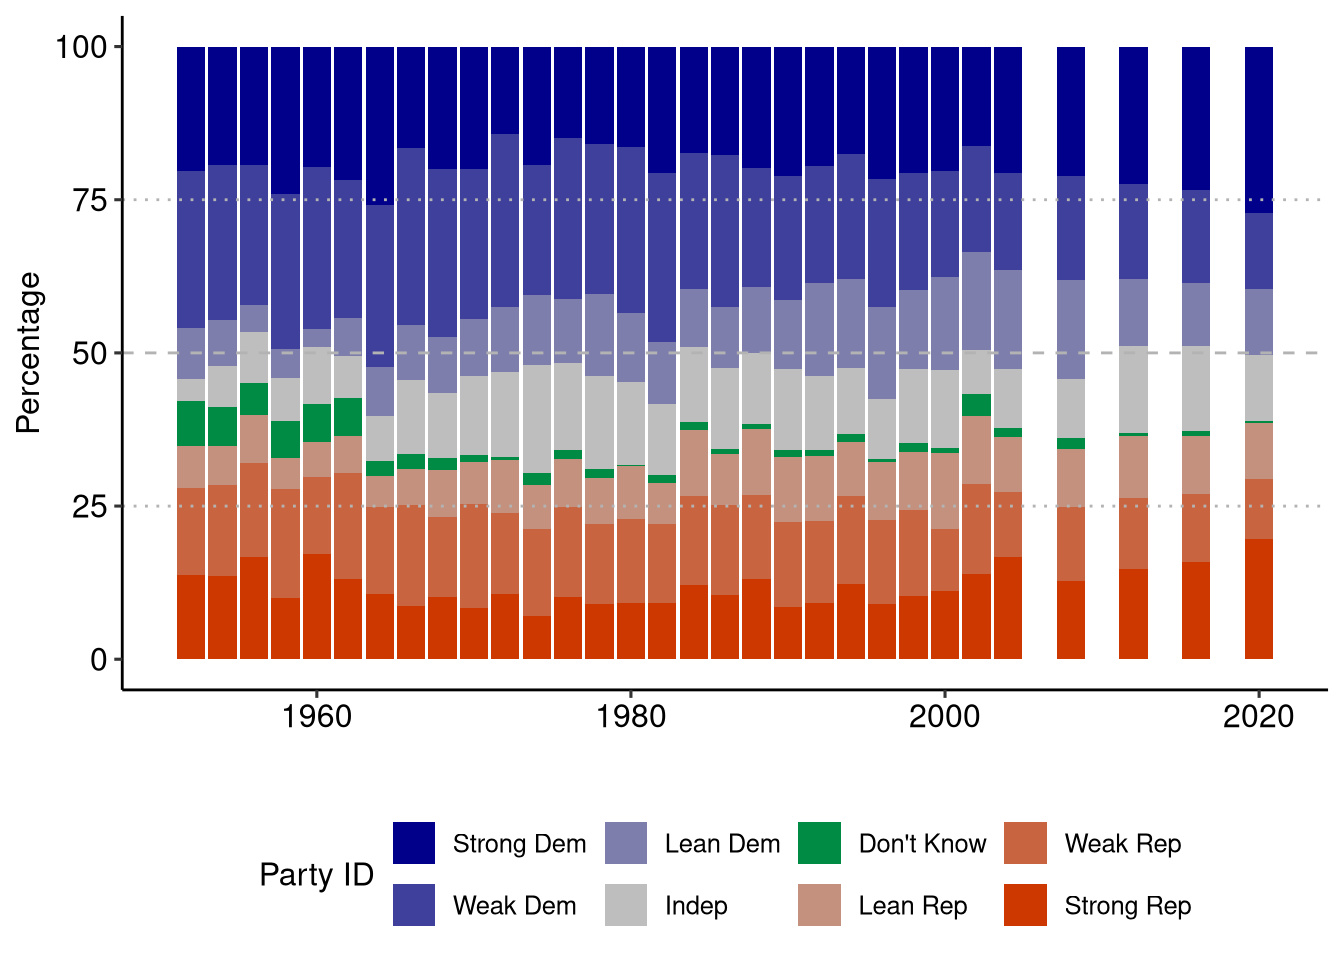
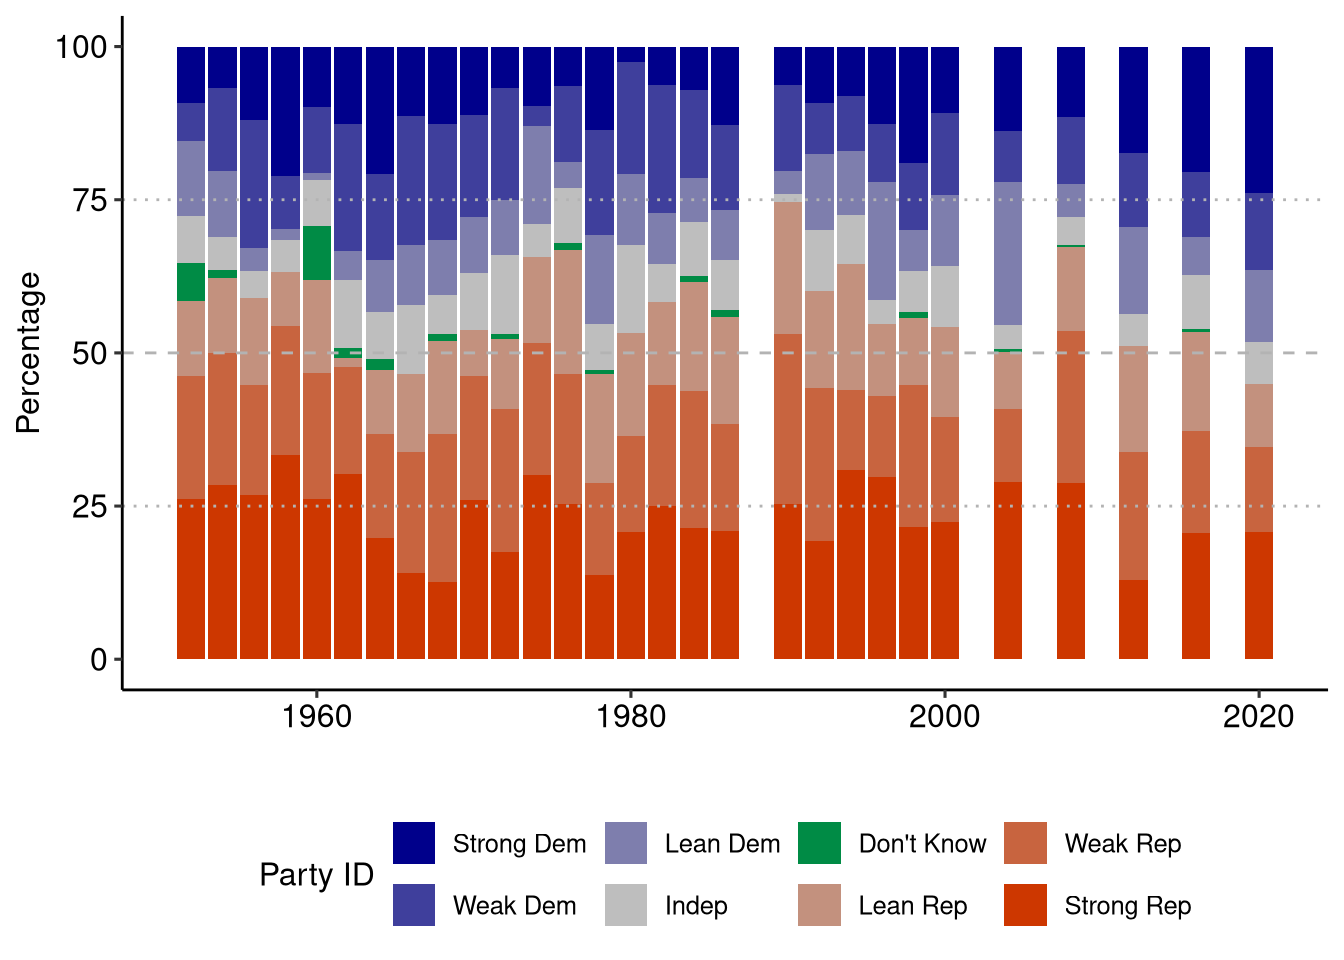
By Gender
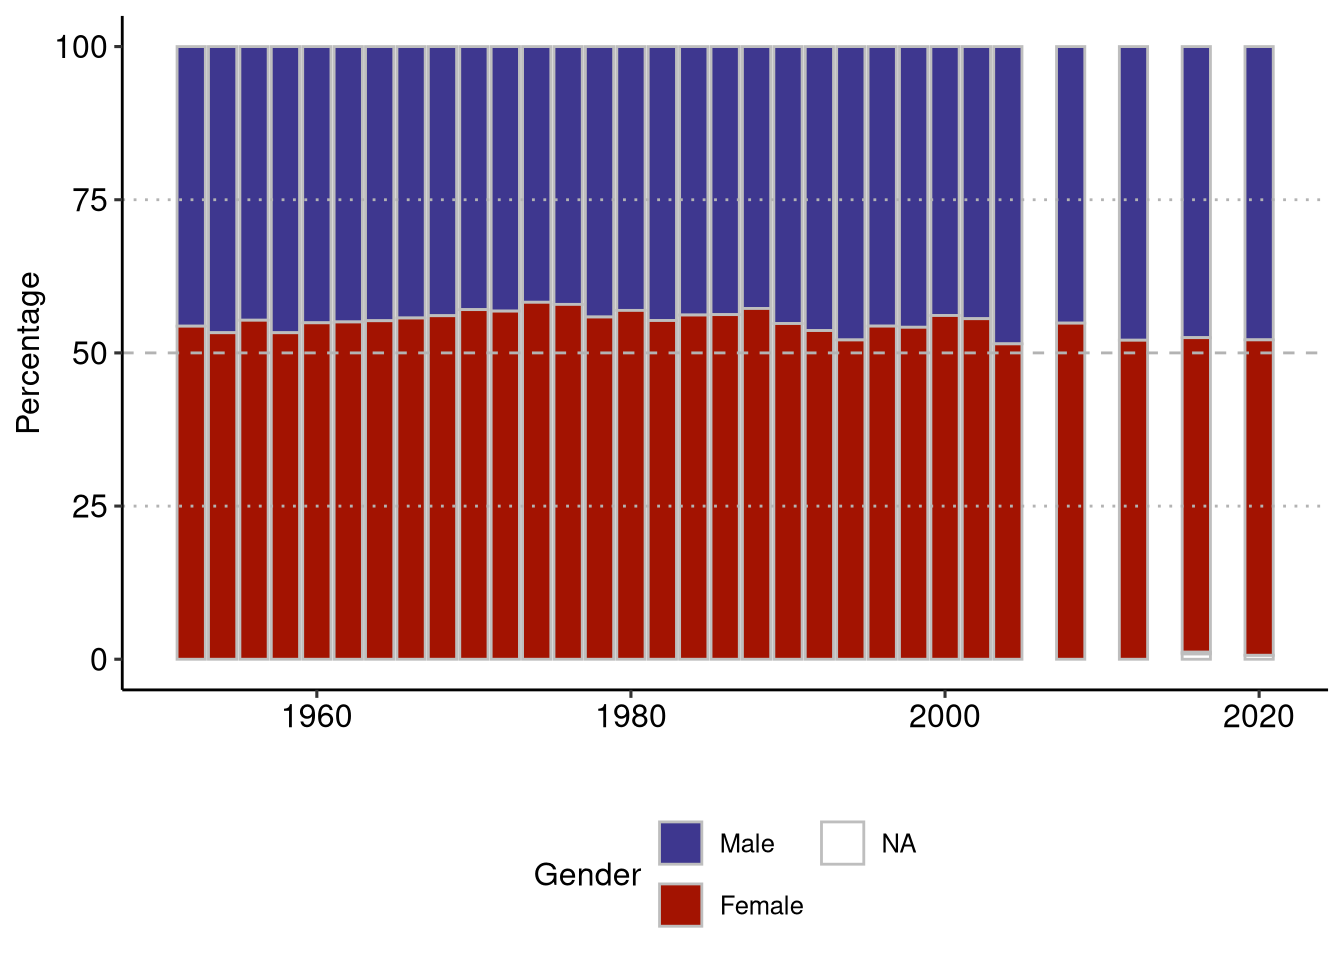
The summary statistics are available here. The Group N column is the number of respondents in a given group in a given year while the N column is the number of respondents who selected the answer in the Party column.
Note: These are all weighted statistics (using the VCF0009z weights) and are provided if you’d like to make you own visualizations. If you are interested in doing your own analysis, use the raw data available from the American National Election Studies survey.
By Income
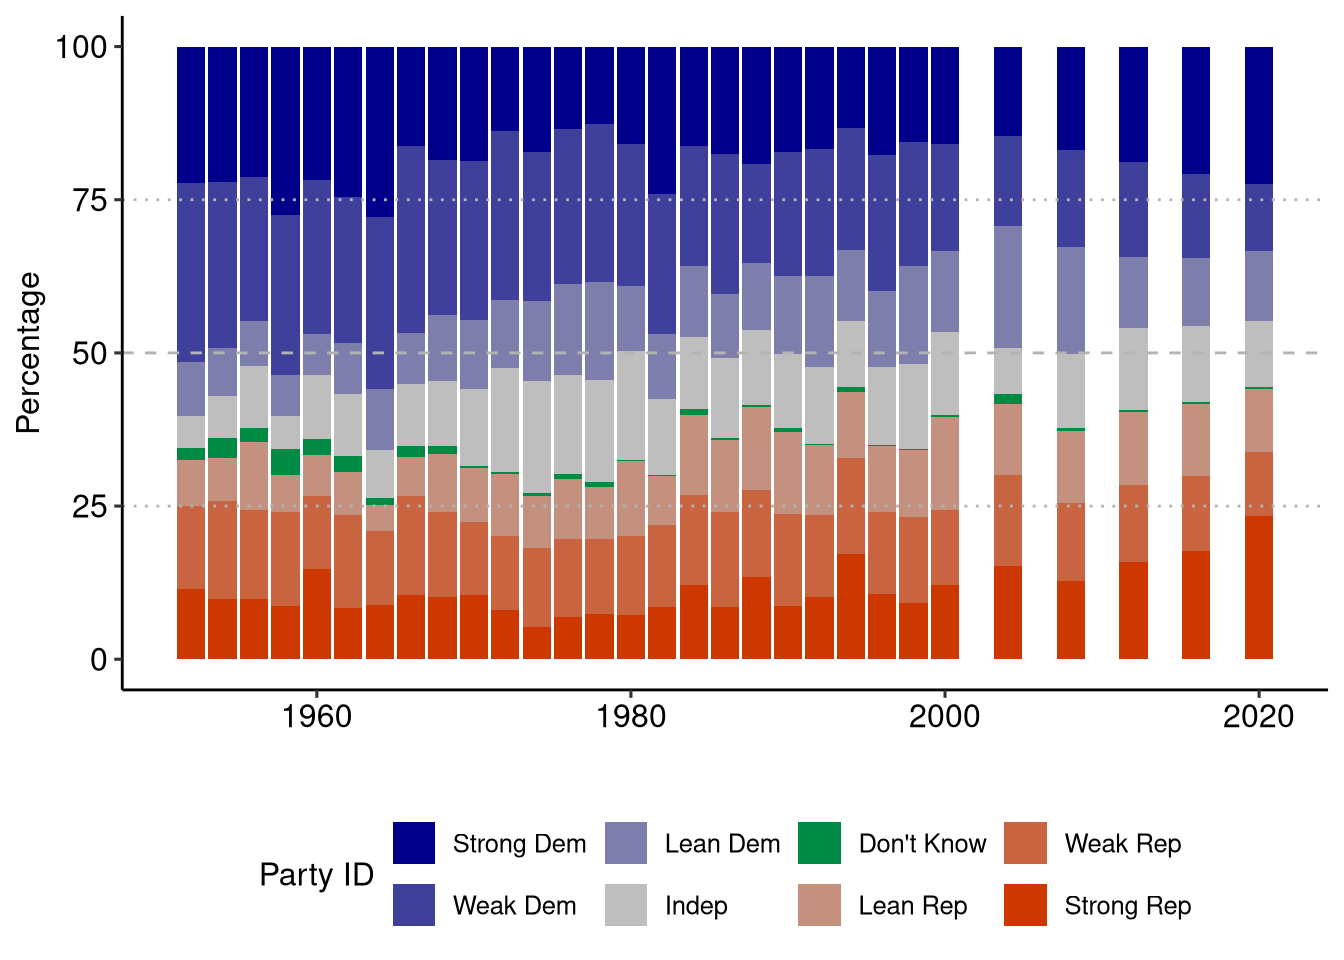
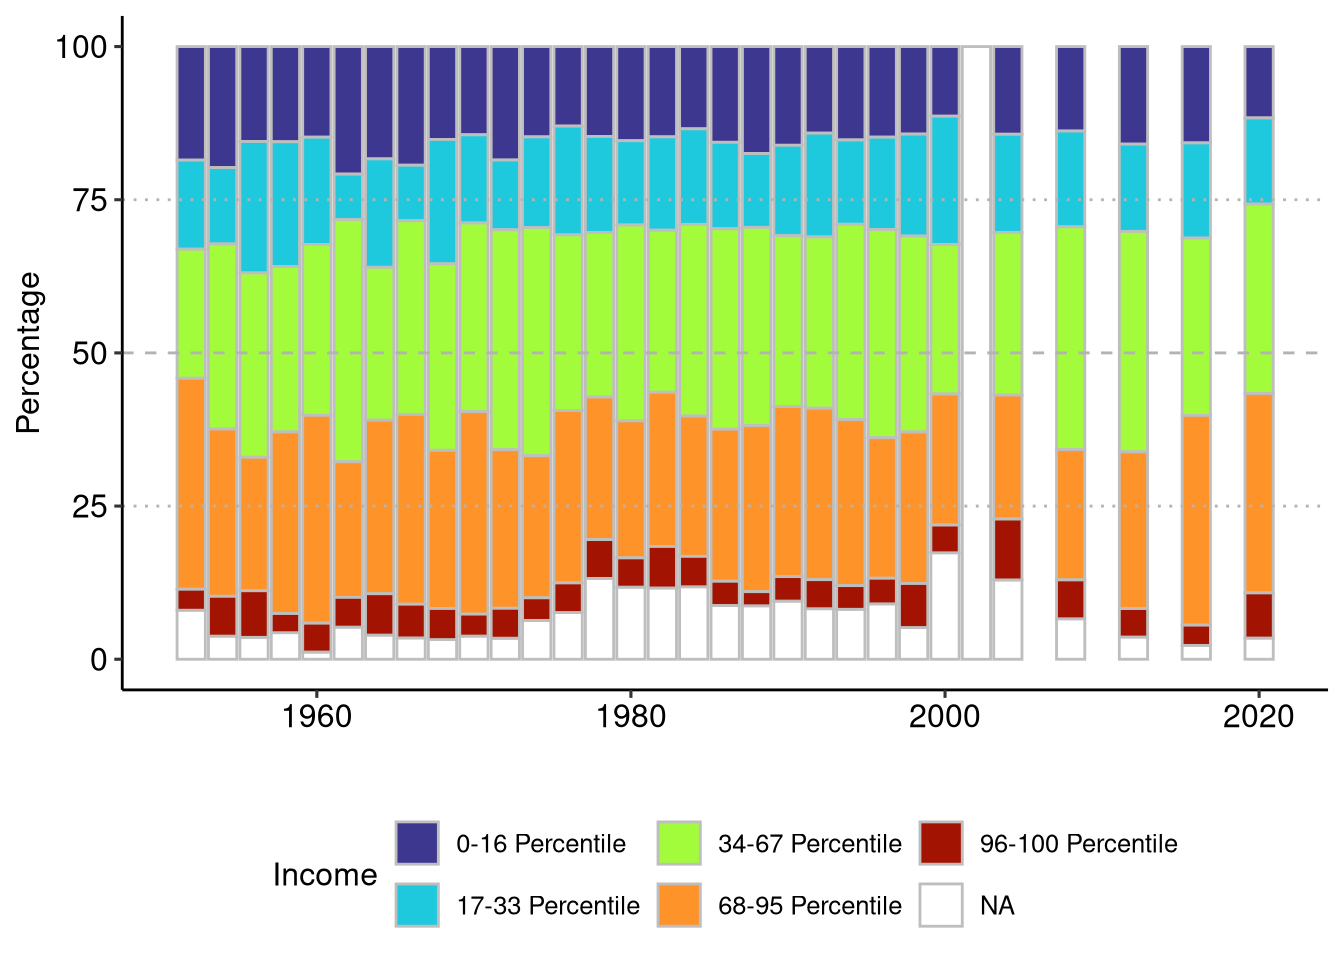
The summary statistics are available here. The Group N column is the number of respondents in a given group in a given year while the N column is the number of respondents who selected the answer in the Party column.
Note: These are all weighted statistics (using the VCF0009z weights) and are provided if you’d like to make you own visualizations. If you are interested in doing your own analysis, use the raw data available from the American National Election Studies survey.
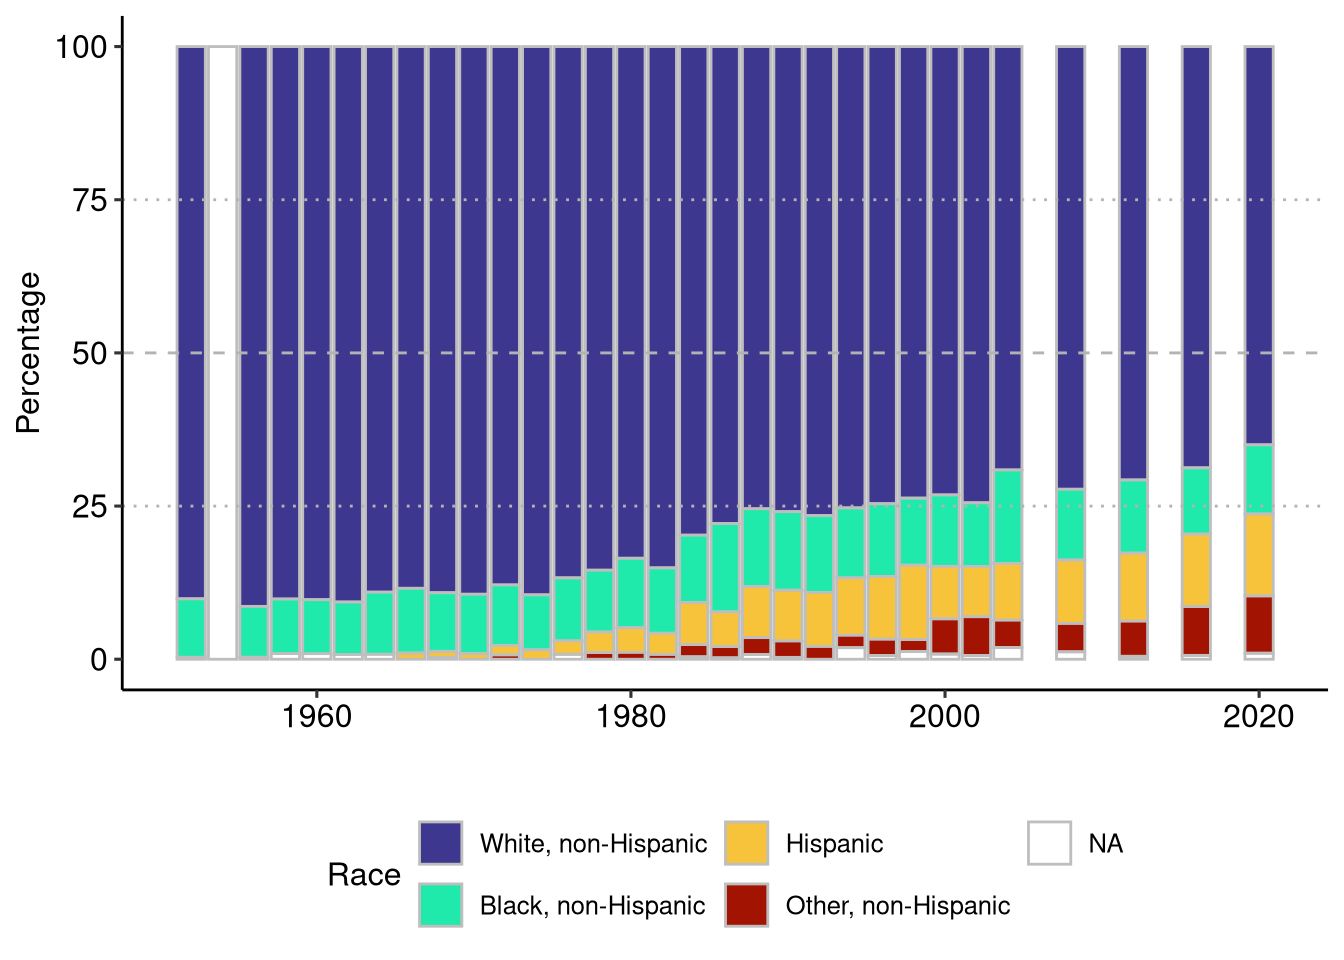
By Race
Note: Options for race have varied significantly overtime, and the size of the ANES means that there are very small samples Asian and American Indian. Because of this they are grouped together into “Other, non-Hispanic” which also includes those who identify as multiple racial categories. I also drop any years where there are fewer than 50 individuals in the sample. This is far from ideal.
The summary statistics are available here. The Group N column is the number of respondents in a given group in a given year while the N column is the number of respondents who selected the answer in the Party column.
Note: These are all weighted statistics (using the VCF0009z weights) and are provided if you’d like to make you own visualizations. If you are interested in doing your own analysis, use the raw data available from the American National Election Studies survey.
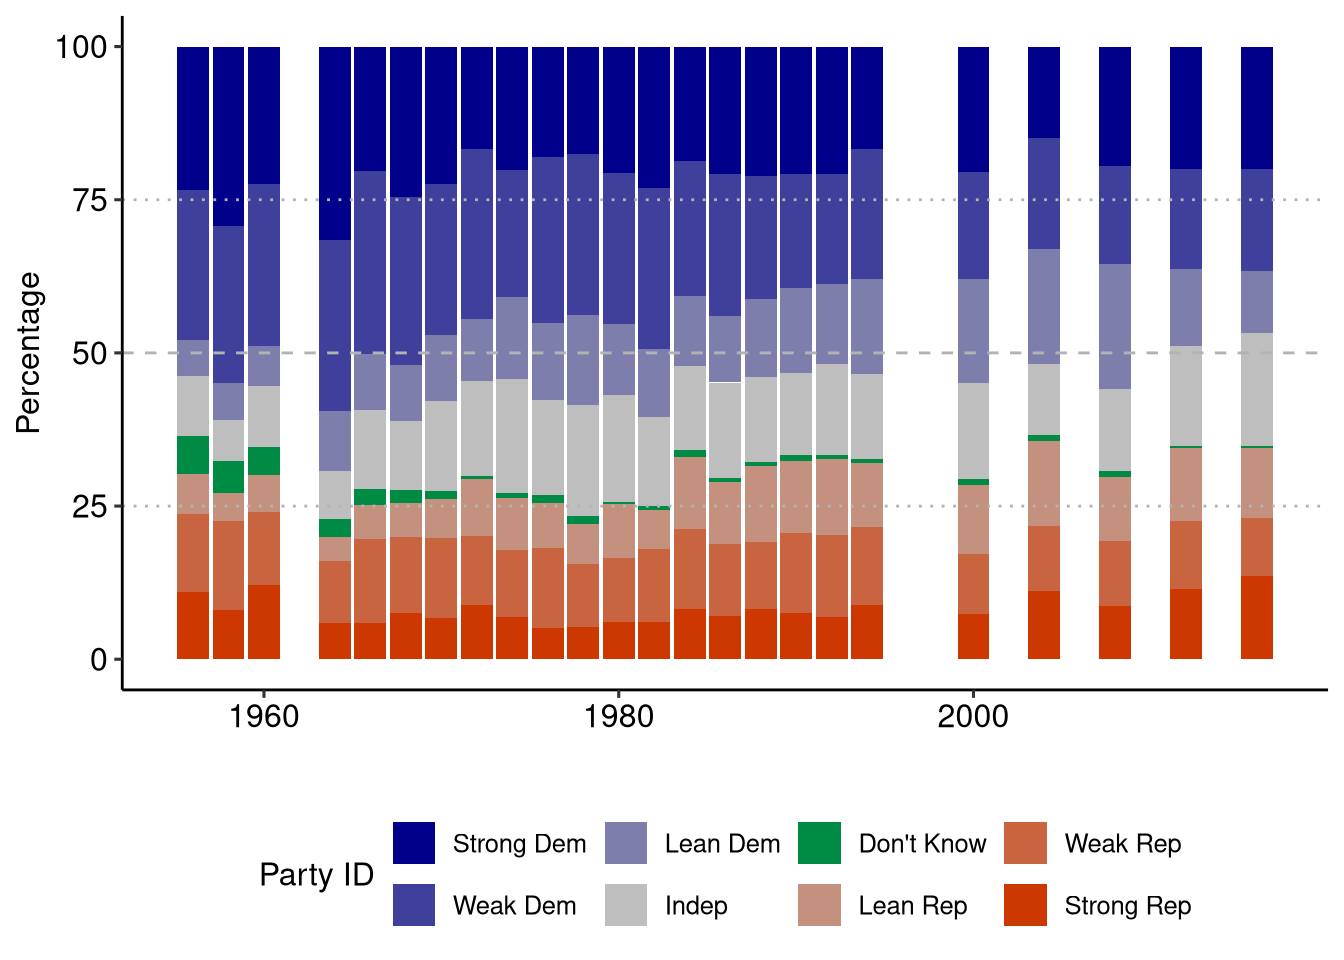
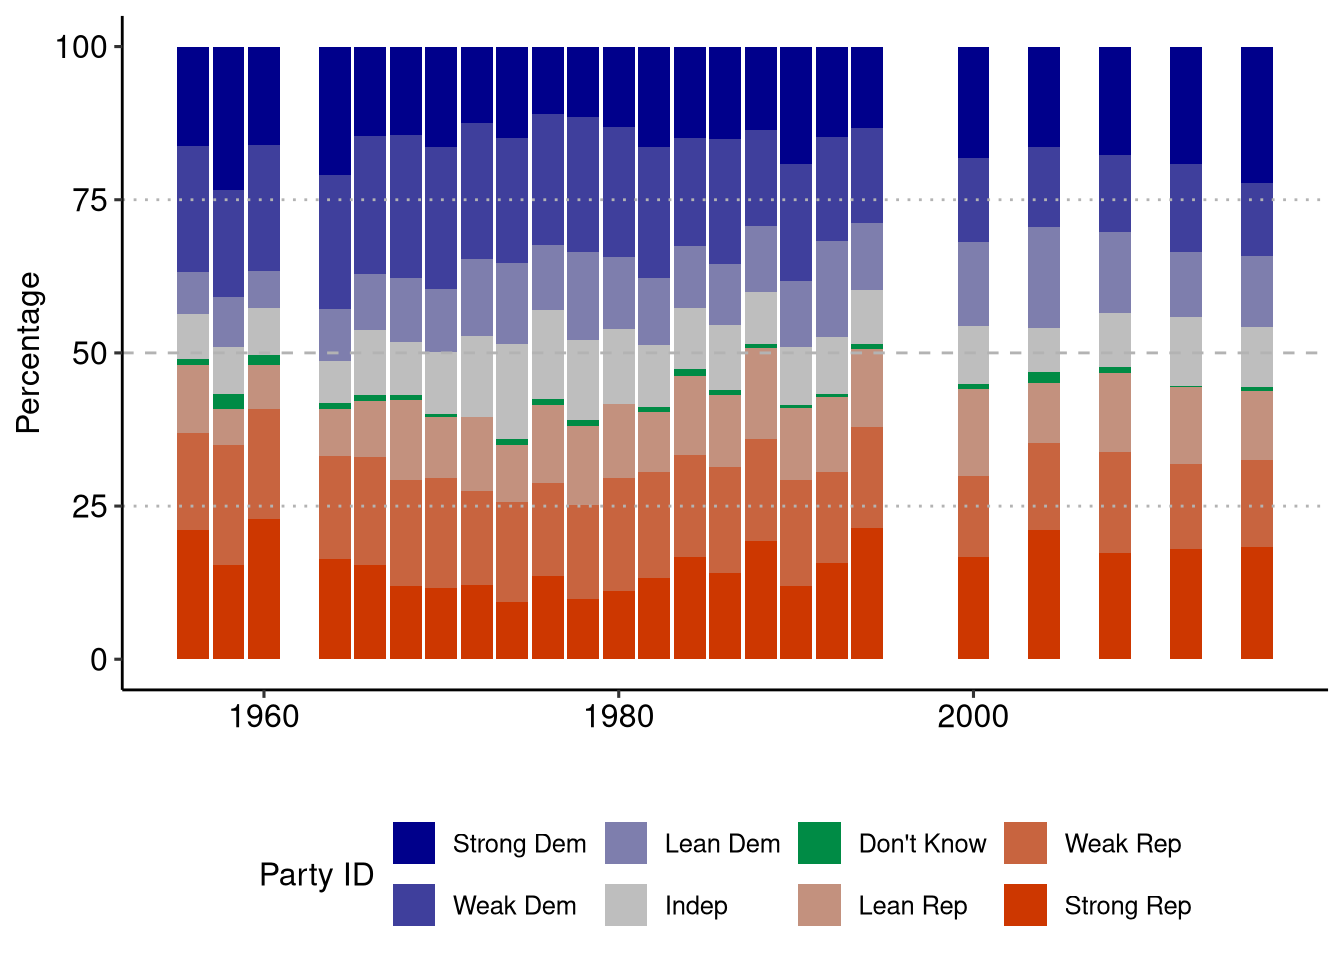
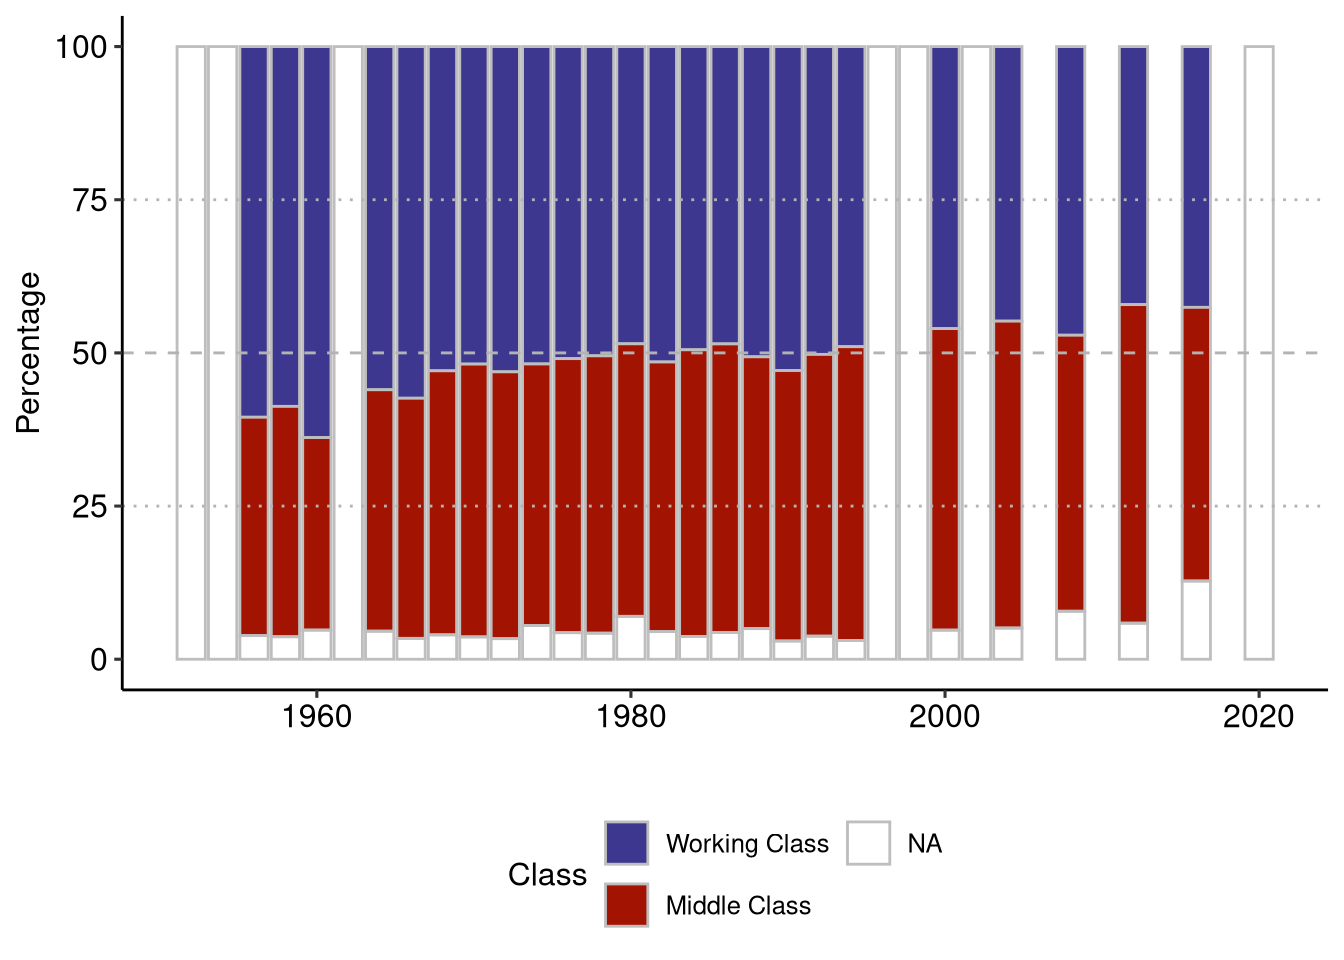
By Subjective Class
Subjective class is what an individual identifies as when asked. The question used by ANES is:
There’s been some talk these days about different social classes. Most people say they belong either to the middle class or the working class. Do you ever think of yourself as belonging in one of these classes? Which one?
In some years respondents were asked where they identified within “working” or “middle” but not consistently so that has been dropped from this analysis.
The summary statistics are available here. The Group N column is the number of respondents in a given group in a given year while the N column is the number of respondents who selected the answer in the Party column.
Note: These are all weighted statistics (using the VCF0009z weights) and are provided if you’d like to make you own visualizations. If you are interested in doing your own analysis, use the raw data available from the American National Election Studies survey.
By Union Status
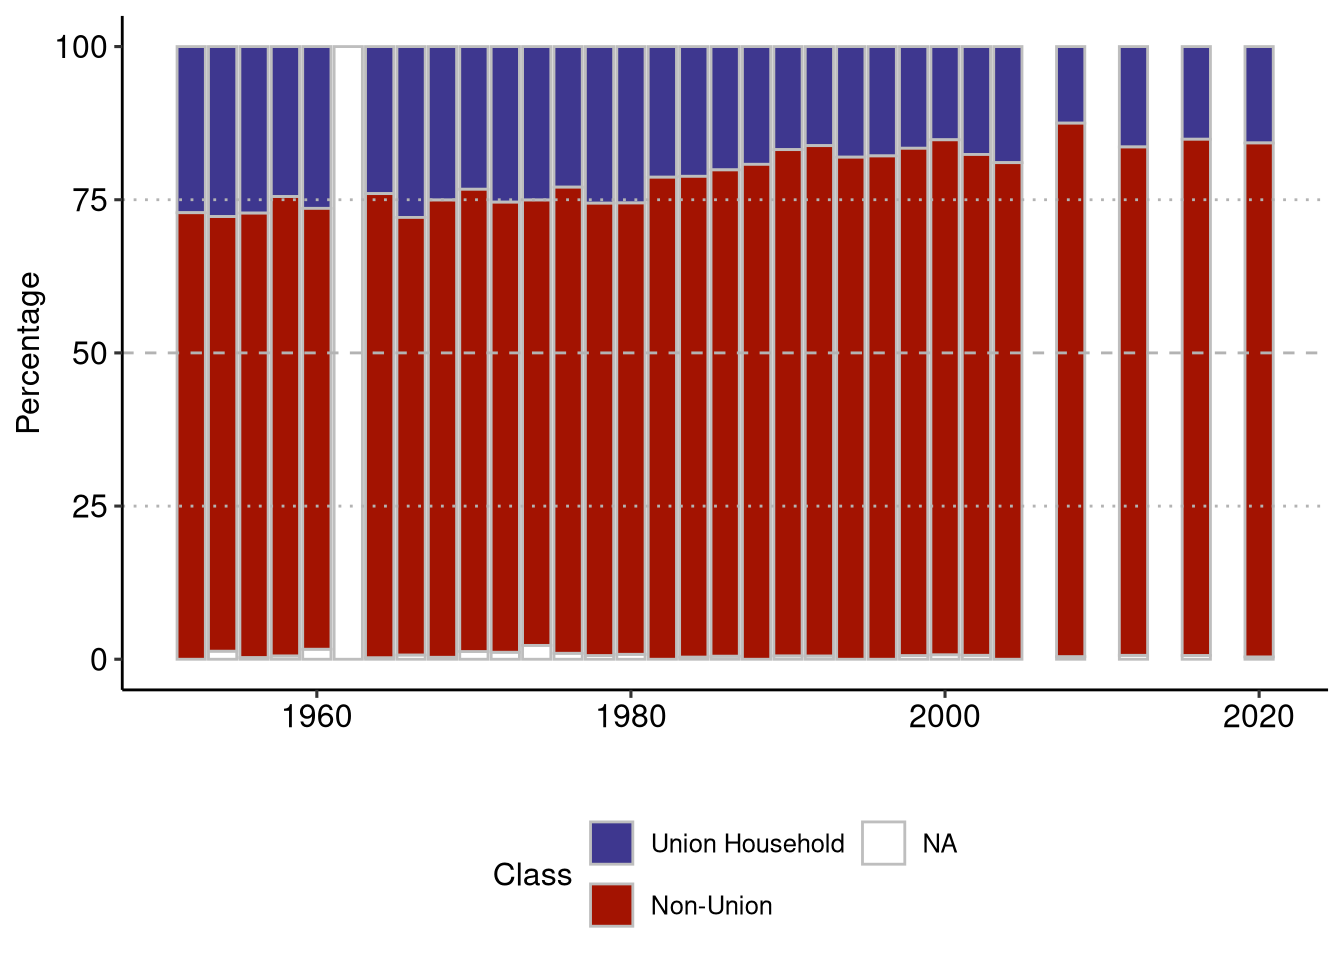
The summary statistics are available here. The Group N column is the number of respondents in a given group in a given year while the N column is the number of respondents who selected the answer in the Party column.
Note: These are all weighted statistics (using the VCF0009z weights) and are provided if you’d like to make you own visualizations. If you are interested in doing your own analysis, use the raw data available from the American National Election Studies survey.
Data Notes
All data presented here is from the American National Election Studies survey using the VCF0009z weights.